Analysis > Line Profile > Tracking Edges
The Edge Track facility within the Line Profile module can be used to track frame by frame changes in the position of the left or right edges or width of a line profile.
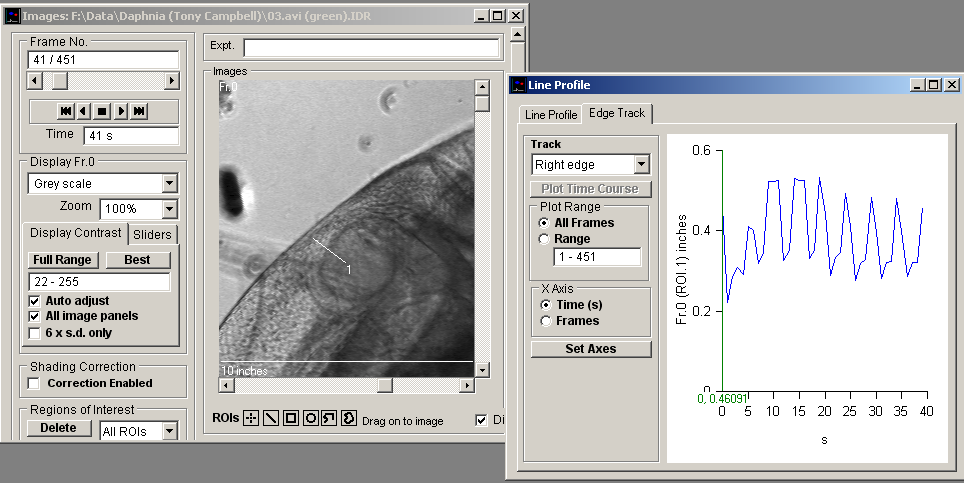
To track the edge of line profile that has been set up on the Line Profile page:
1. On the Line Profile page, use the horizontal Threshold cursor to set the tracking point on the selected edge of the line profile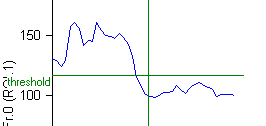
2. Track: Select the part of the profile to be tracked: Left Edge or Right Edge for the right or left hand end edges of the profile or Width to track the distance between the left and right edges.
3.
4. Plot Range: Select the range of frames within the data file to be tracked. Select the All Frames option to track all image frames in the file or select Range and enter the sub-range to be used.
5.
6. X Axis: Select Time(s) to plot the edge vs time or Frames to plot vs. frame number.
7.
8. Click Plot Time Course to plot the edge track graph.
The X and Y axis range and labels of the graphs can be modified by clicking the Set Axes button to open the Customise Graph dialog box.
The displayed plot can be printed (File / Print Graph) or copied to the Windows clipboard as data (Edit / Copy Graph Data) or as an image (Edit / Copy Graph as Image).