Analysis > Event Detection & Analysis > Viewing Detected Events
The set of events detected within a data file can be viewed by selecting the View Events page in the Event Detection & Analysis window.
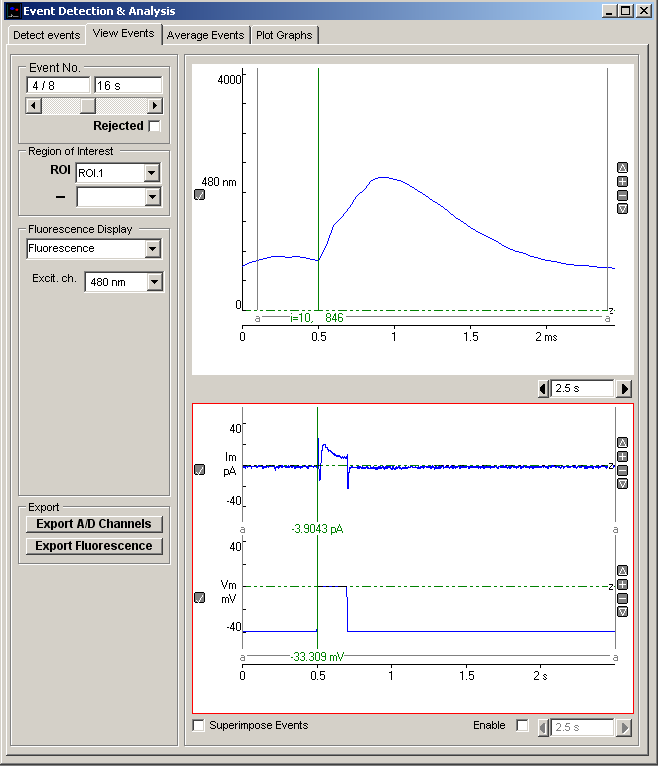
Individual events can be displayed using the Event No. slider bar or by entering the number of the event in the Event No. box and pressing the return key.
The selected fluorescence signal is display in the top display panel and the analogue channels (if any) in the bottom panel. The duration of each signal display panel can be adjusted separately using the Duration box at the right hand edge of each display.
Events can be marked as rejected by ticking the Rejected option. Rejected records are excluded from averages, export lists, or waveform measurement plots.
Displayed events can be printed (File / Print Graph) or copied to the Windows clipboard as data (Edit / Copy Graph Data) or as an image (Edit / Copy Graph as Image). (A plot is selected for printing/copying by clicking on it. Selected plot is outlined in red.)