Analysis > Time Course Analysis > Plotting Time Courses
To plot the time course of changes in image intensity:
1. Define one or more regions of interest within the image displayed in the Images window.
2. Select a region of interest (or analogue signal) to be plotted from the Source ROI/Channel list. [Optional] To subtract the intensity of a background region of interest, select an ROI from the Background ROI list (otherwise leave it blank).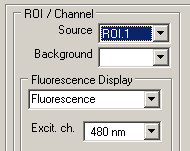
3. Select the range of frames to be plotted either by selecting All Frames or selecting Range and specifying a range of frames.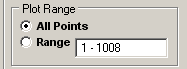
4. Select the time units for the plot ( Secs or Mins).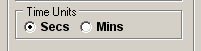
5. The Fluorescence Display option determines how the fluorescence signal from the ROI selected in Source is displayed: in terms of either the raw fluorescence intensity (in pixel grey scale units), the fractional change relative to a standard level, the ratio at two different wavelengths, or the computed ion concentration.
Select the Fluorescence option to display the raw fluorescence signal. If the file contains multi-wavelength images, select the required wavelength from the list.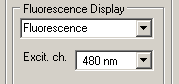
or
Select the Fluorescence dF/F0 option to display the fluorescence signal as a fraction of a predefined baseline fluorescence level (F0).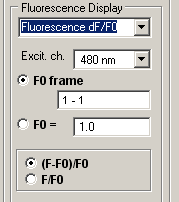
Select the F0 frame option to define the baseline fluorescence level as the average fluorescence between the range of frames defined in the adjacent range box, or select the F0= option and enter the value into the F0= box. Select the (F-F0)/F0 option to plot the fractional difference relative to F0 or F/F0 to plot the fraction of F0.
or
Select the Fluorescence ratio option to the display fluorescence ratio of two wavelengths (only available for multi-wavelength image files).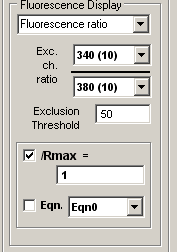
Select the wavelengths to be ratioed from the Exc. ch. ratio wavelength selection lists. Enter the lowest acceptable intensity level for the denominator wavelength in the Exclusion Threshold box. (Ratios with denominators below this level are set to zero.) To display the ratio as a fraction of a maximum ratio, tick the /Rmax= option and enter the maximum in the /Rmax= box. To display ion concentration computed from the fluorescence ratio, tick the Eqn. option and select an equation.
6. Click the Add to New Plot button to create a new Y axis and to plot the time course graph of the ROI selected in the Source list OR click the Add all ROIs button to add all ROIs (except that selected as the background subtraction ROI) to the plot.
If a plot already exists, you can add the new time course graph to an existing Y axis by selecting its Axis No. from the list and clicking the Add To Plot button instead.)
The displayed plot can be printed (File / Print Graph) or copied to the Windows clipboard as data (Edit / Copy Graph Data) or as an image (Edit / Copy Graph as Image). (A plot is selected for printing/copying by clicking on it. Selected plot is outlined in red.)