Analysis > Spectral Analysis > Plotting Fluorescence Excitation Spectra
To analyse spectral series data files, recorded using the Spectrum excitation light option, select
AnalysisSpectral Analysis
to open the spectral window. Each file is divided into a series of spectral blocks, each block containing a series of images with the excitation light wavelength incremented from the lower to upper limit of the spectrum. The spectral analysis modules calculates and displays the intensity from defined regions of interest within the image vs. excitation light wavelength throughout the time series.
To display the excitation spectrum for a selected region of interest:
1. In the Images window, place one or more ROIs over regions of interest on cells where the intensity spectra are to be computed and displayed.
2. Place an ROI on an image region not containing cells to provide a measure of background intensity.
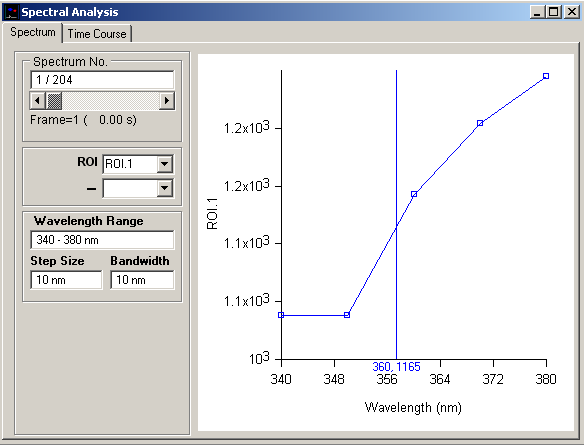
3. Select the Spectrum page in the Spectral Analysis window.
4. Select a region of interest for display in the ROI list.
5. Select a background region to be subtracted in the subtraction ROI list (optional).
6. Individual spectra throughout the image series file can selected using using Spectrum No. slider bar. The Frame number and time of the start of the spectrum within the file is also indicated.
The displayed graph can be printed (File / Print Graph) or copied to the Windows clipboard as data (Edit / Copy Graph Data) or as an image (Edit / Copy Graph as Image).