Plotting Waveform Measurements
From WinFluor
Analysis > Event Detection & Analysis > Plotting Waveform Measurements
A series of waveform measurements can be computed from the detect event records and plotted on the Plot Graphs page.
1. Before plotting a graph, switch to the View Events page and use the waveform measurement cursors to define the region of each event record to be analysed.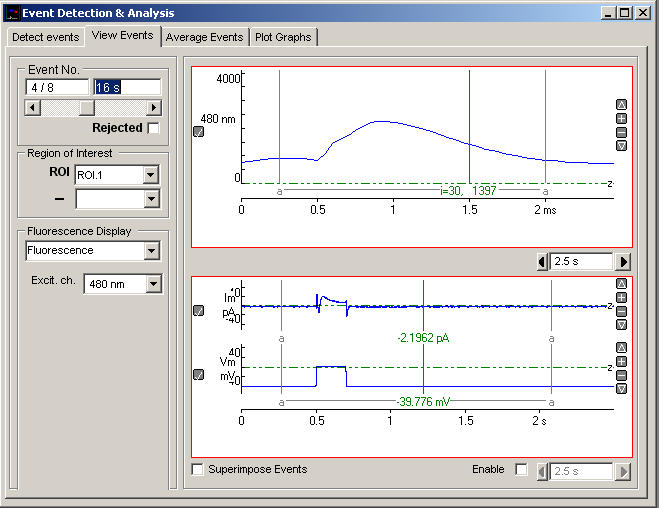
2. If you want to measure a specific point on each event waveform (Display Cursor measurement) drag the green measurement cursor to the point to be measured.
3. The pair of analysis region cursors (grey (a) cursors linked by a horizontal bar) define the region of the displayed event record to be measured. Points outside this region are ignored for peak and time course measurements. They are initially set to include the whole record. Move these cursors, if you want to limit analysis to a specific region of the record.
4. If you want to exclude an event from a measurement plot tick the event’s Rejected box.
5. Change to the Plot Graphs page.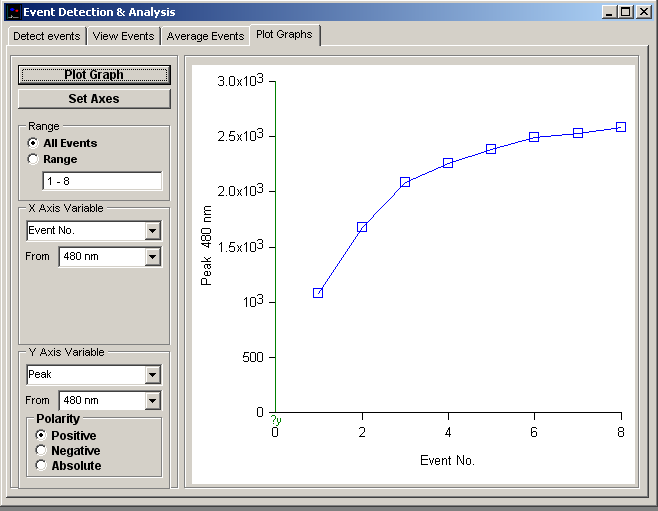
6. Select the range of events to be plotted either by selecting All Events or by selecting Range and entering the range of events. (Note. Events marked as Rejected are not included in the plot.)
7. Select the type of measurement (see Table.1 below) and the signal to be measured and plotted on the X axis of the graph from the X Axis variable lists.
8. Select the type of measurement (see Table.1 below) and the signal to be measured and plotted on the Y axis of the graph from the Y Axis variable lists.
9. Click the Plot Graph button to plot the selected graph.
10. To modify the graph axes and labels, click the Set Axes button.
The displayed graph can be printed (File / Print Graph) or copied to the Windows clipboard as data (Edit / Copy Graph Data) or as an image (Edit / Copy Graph as Image).
|
Table 1. Waveform Measurements |
|
|
Event No. |
Sequence number of event in detected event list. |
|
Time |
Time (since start of recording) that event was detected. (s) |
|
Interval |
Time between event and previous event (s) |
|
Frequency |
Event frequency (reciprocal of Interval) |
|
Cursor |
Average of block of points around display cursor. |
|
Peak |
Peak amplitude within defined analysis region (positive, negative or absolute peak level can be selected) |
|
Area |
Integral of signal within analysis region. |
|
T.rise |
Time taken to rise from 10% to 90% of signal peak amplitude. |
|
T(90%) |
Time taken to fall from peak to 10% of peak. |
|
Tau(decay) |
Exponential decay time constant. |
|
Duration |
Event duration |
|
Baseline |
level at start of display window. |