Measures
In a cube, a measure is a set of values that are based on a column in the cube's
For each measure in a cube, the cube contains a value for every cell in the cube excluding the cells for the other measures. So, no matter which combination of members is used in a query, a measure value can be retrieved. The value may be retrieved from the cube's
Measures are summarized by Microsoft® SQL Server™ 2000 Analysis Services, and the resulting aggregations are stored for quick retrieval by end users querying cubes. For more information, see Aggregations.
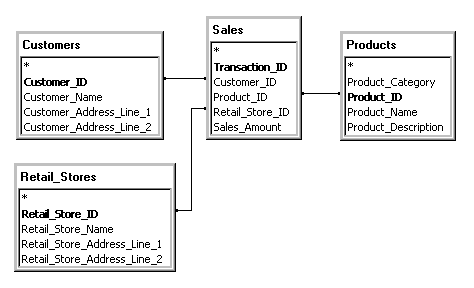
Consider a cube with the following schema and a single measure, Sales, based on the Sales_Amount column in the Sales fact table.

Assume a
In the object hierarchy, measures are immediately subordinate to the cube. The measures of a cube are created when the cube is created. You select the measures for a
Each measure is derived from a column in a fact table. Because a regular cube can have only one fact table in its schema, all of the cube's measures must be contained within it.
After measures and their cube are created, partitions or aggregations are usually the next objects to be created. Partitions are created only if a cube is to contain multiple partitions; a single partition is created automatically for a cube when the cube is created. For more information, see Partitions and Aggregations.
In Analysis Manager, a measure is identified by the following icon.

Each measure specifies an aggregate function that determines how values in the measure's source column are aggregated. This function also determines how measure values for sibling members are aggregated to produce a value for their parent. The most commonly used aggregate function is Sum, but Min, Max, Count, and Distinct Count are also available. For more information, see Aggregate Functions.
Analysis Services supports measures based on both additive and nonadditive columns. Additive columns can be summed. For example, a monetary column is additive. Additive columns are suitable as measures in a cube regardless of the aggregate function that is used. Nonadditive columns cannot be summed meaningfully. For example, a numeric column containing an identifier such as Account Number is nonadditive. Nonadditive columns are also suitable as measures in a cube, but in order to be meaningful they must be summarized by the Count or Distinct Count aggregate function.
Note Using the Distinct Count aggregate function imposes restrictions on some cube functionality. For more information, see Using Aggregate Functions.
A measure can be derived from multiple columns combined in an expression. For example, the Profit measure is the difference of two numeric columns: Sales and Cost. For information about adding this type of measure to a cube, see Adding a Multiple-Column Measure to a Cube.
Calculated members can be used as measures. Calculated member values are created from formulas when the cube is browsed, but the values are not stored. Thus, calculated members save storage. For more information, see Calculated Members.
A cube contains a special type of dimension that contains a member for each measure. This dimension is called the Measures dimension. When end users browse the cube, they can slice by a member in the Measures dimension to display values for only a single measure, or they can place the Measures dimension on an axis so that they can see values for all the cube's measures. The Measures dimension is different from other dimensions insofar as it:
- Is created automatically when a cube is created.
- Cannot be displayed or edited in Dimension Editor. (Use Cube Editor or Virtual Cube Editor to maintain measures.)
- Is always flat (that is, always contains only one level).
For any dimension, including the Measures dimension, you can create a custom rule for dimension security to restrict end users' access to individual members. Because the Measures dimension is flat, many of the complexities of these custom rules regarding ancestors and descendants do not apply to the Measures dimension. For more information, see Custom Rules in Dimension Security.
Another method of restricting access to measures is to use cell security. For more information, see Cell Security.
If you are programming with Decision Support Objects (DSO), the class types associated with the measure are:
- clsCubeMeasure
- clsPartitionMeasure
- clsAggregationMeasure
How Measures Appear to End Users
Measures form the core of cube information presented to end users. Presentation may be tabular or graphical, depending on the client application with which end users browse cubes, but measures are the information end users focus on.
In tabular presentations, measures are displayed in rows and columns. Whereas a cube's dimensions determine the column and row headings, the measures are the data in the rows and columns. However, if you specify multiple measures in a cube, they too provide multiple headings to separate the measures.
In graphical presentations, measures may be displayed in a variety of ways, including lines, shapes, colors, shades, and shadows. Nevertheless, as in tabular presentations, the measures occupy the central, focal portion of the presentation while the dimensions provide peripheral labels.