Introduction to Cubes
Cubes are the main objects in online analytic processing (OLAP), a technology that provides fast access to data in a data warehouse. A cube is a set of data that is usually constructed from a subset of a data warehouse and is organized and summarized into a multidimensional structure defined by a set of
A cube provides an easy-to-use mechanism for querying data with quick and uniform response times. End users use client applications to connect to an Analysis server and query the cubes on the server. In most client applications, end users issue a query on a cube by manipulating the user interface controls, which determine the contents of the query. This spares end users from writing language-based queries. Precalculated summary data called
Every cube has a schema, which is the set of joined tables in the data warehouse from which the cube draws its source data. The central table in the schema is the fact table, the source of the cube's measures. The other tables are dimension tables, the sources of the cube's dimensions. For more information about schemas, see Cube Structure.
A cube is defined by the measures and dimensions that it contains. For example, a cube for sales analysis includes the measures Item_Sale_Price and Item_Cost and the dimensions Store_Location, Product_Line, and Fiscal_Year. This cube enables end users to separate Item_Sale_Price and Item_Cost into various categories by Store_Location, Product_Line, and Fiscal_Year.
Each cube dimension can contain a hierarchy of
Dimension levels are a powerful data modeling tool because they allow end users to ask questions at a high level and then expand a dimension hierarchy to reveal more detail. For example, an end user starts by asking to see Item_Cost values of products for the past three fiscal years. The end user may notice that 1998 Item_Cost values are higher than those in other years. Expanding the Fiscal_Year dimension to the Month level, the end user sees that Item_Cost values were especially high in the months January and August. The end user may then explore levels of the Store_Location dimension to see if a particular region contributed significantly to the high Item_Cost values, or may expand into the Product_Line dimension to see if Item_Cost values were high for a particular product group or product. This type of exploration, known as
For more information about dimensions, levels, and measures, see Dimensions, Levels, and Measures.
For example, consider the following Imports cube, which contains two measures, Packages and Last, and three dimensions, Route, Source, and Time.
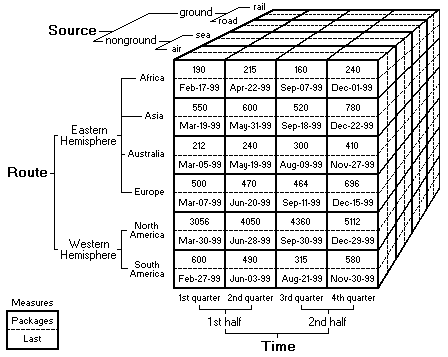
The smaller alphanumeric values around the cube are the members of the dimensions. Example members are ground, Africa, and 1st quarter.
The values within the cube represent the measures. Example measures are Packages: 190 and Last: Feb-17-99. These values exist for all cells in the cube but are shown only for those in the foreground. (In a real cube, the words Packages and Last would not appear in the cube cells, but they are shown here to distinguish the measures. In a real cube, measures are separated within a special dimension called the Measures dimension.)
The Packages measure represents the number of imported packages, and it aggregates by the Sum function. The Last measure represents the date of receipt, and it aggregates by the Max function. The Route dimension represents the means by which the imports reach their destination. The Source dimension represents the locations where the imports are produced. The Time dimension represents the quarters and halves of a single year.
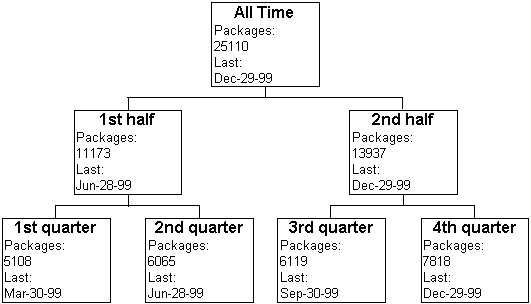
End users of a cube can determine its measures' values for each member of every dimension. This is possible because measure values are aggregated by the members. For example, the measure values shown in the preceding illustration aggregate within the Time dimension as follows.
In addition to aggregating within a single dimension, measures aggregate for all combinations of members from different dimensions. This allows end users to evaluate measures by members in multiple dimensions simultaneously. For example, if an end user wants to analyze quarterly imports that arrived by air from the Eastern Hemisphere and Western Hemisphere, the end user can issue the appropriate query on the cube to retrieve the following dataset.
| Packages | Last | |||||||
|---|---|---|---|---|---|---|---|---|
| All Sources | Eastern Hemisphere | Western Hemisphere | All Sources | Eastern Hemisphere | Western Hemisphere | |||
| All Time | 25110 | 6547 | 18563 | Dec-29-99 | Dec-22-99 | Dec-29-99 | ||
| 1st half | 11173 | 2977 | 8196 | Jun-28-99 | Jun-20-99 | Jun-28-99 | ||
| 1st quarter | 5108 | 1452 | 3656 | Mar-30-99 | Mar-19-99 | Mar-30-99 | ||
| 2nd quarter | 6065 | 1525 | 4540 | Jun-28-99 | Jun-20-99 | Jun-28-99 | ||
| 2nd half | 13937 | 3570 | 10367 | Dec-29-99 | Dec-22-99 | Dec-29-99 | ||
| 3rd quarter | 6119 | 1444 | 4675 | Sep-30-99 | Sep-18-99 | Sep-30-99 | ||
| 4th quarter | 7818 | 2126 | 5692 | Dec-29-99 | Dec-22-99 | Dec-29-99 |
A cube can contain up to 128 dimensions, each with thousands or millions of members, and up to 1,024 measures. A cube with a modest number of dimensions and measures usually satisfies the requirements of end users.
There are several varieties of cubes in Microsoft® SQL Server™ 2000 Analysis Services. Although
Cubes are immediately subordinate to the database in the object hierarchy. A database is a container for related cubes and the objects they share. You must create a database before you create a cube. For more information, see Databases.
In the object hierarchy, the following objects are immediately subordinate to the cube:
- Data sources
A cube has a single data source. It can be selected from the data sources in the database or created during cube creation. A cube's dimensions must have the same data source as the cube, but its partitions can have different data sources.
- Measures
A cube's measures are not shared with other cubes. The measures are created when the cube is created. A cube can have up to 1,024 measures.
- Dimensions
A cube's dimensions are either shared with other cubes in the database or private to the cube. Shared dimensions can be created before or during cube creation. Private dimensions are created when the cube is created. Although the term cube suggests three dimensions, a cube can have up to 128 dimensions.
- Partitions
A single partition is automatically created for a cube when the cube is created. If you have installed Analysis Services for SQL Server 2000 Enterprise Edition, after creating a cube, you can create additional partitions in the cube.
- Cube roles
Every cube must have at least one cube role in order to provide access to end users. Cube roles are derived from database roles, which can be created before or after cube creation. Cube roles are created after cube creation.
- Commands
Commands are optional. Commands are created after cube creation.
After cubes are created, partitions or aggregations are usually the next objects to be created. For more information, see Partitions and Aggregations.
Creating a cube involves three steps:
Definition
The definition of a cube is based on the analytical requirements of end users. To define a cube, select a fact table and identify measures within the fact table. Then select or create dimensions, each composed of one or more columns from another table. The Cube Wizard provides an easy way to define cubes. Cube Editor offers additional flexibility for defining and modifying cube structures. For more information, see Building Cubes.
Aggregation design
After you define a new cube, you can design its aggregations using the Storage Design Wizard. Designing the aggregations specifies the summarization strategy. For more information, see Designing Storage Options and Aggregations.
Processing
After you design the aggregations of a new cube, process the cube with the Full process option. This action creates the aggregations. For more information about processing cubes with the Full process option, see Processing Cubes.
After you create a cube, use Cube Editor to maintain it.
If, after you process a cube, you change it, or its source data changes, it is usually necessary to process the cube again. Different processing options are appropriate in different circumstances. For more information about the processing options available for cubes, see Processing Cubes.
For information about the security options for cubes, see Cube Security.
If you are programming with Decision Support Objects (DSO), the class type associated with the cube is clsCube. For more information, see clsCube.