The statusbar displays informational messages.
In general, the left side will show context related information, the middle part will show information about the current capture file, and the right side will show the selected configuration profile. Drag the handles between the text areas to change the size.

This statusbar is shown while no capture file is loaded, e.g. when Wireshark is started.

- The colorized bullet on the left shows the highest expert info level found in the currently loaded capture file. Hovering the mouse over this icon will show a textual description of the expert info level, and clicking the icon will bring up the Expert Infos dialog box. For a detailed description of expert info, see Section 7.4, “Expert Information”.
- The left side shows information about the capture file, its name, its size and the elapsed time while it was being captured. Hovering over a file name will show its full path and size.
-
The middle part shows the current number of packets in the capture file. The following values are displayed:
- Packets: The number of captured packets.
- Displayed: The number of packets currently being displayed.
- Marked: The number of marked packets (only displayed if packets are marked).
- Dropped: The number of dropped packets (only displayed if Wireshark was unable to capture all packets).
- Ignored: The number of ignored packets (only displayed if packets are ignored).
- Load time: The time it took to load the capture (wall clock time).
- The right side shows the selected configuration profile. Clicking in this part of the statusbar will bring up a menu with all available configuration profiles, and selecting from this list will change the configuration profile.
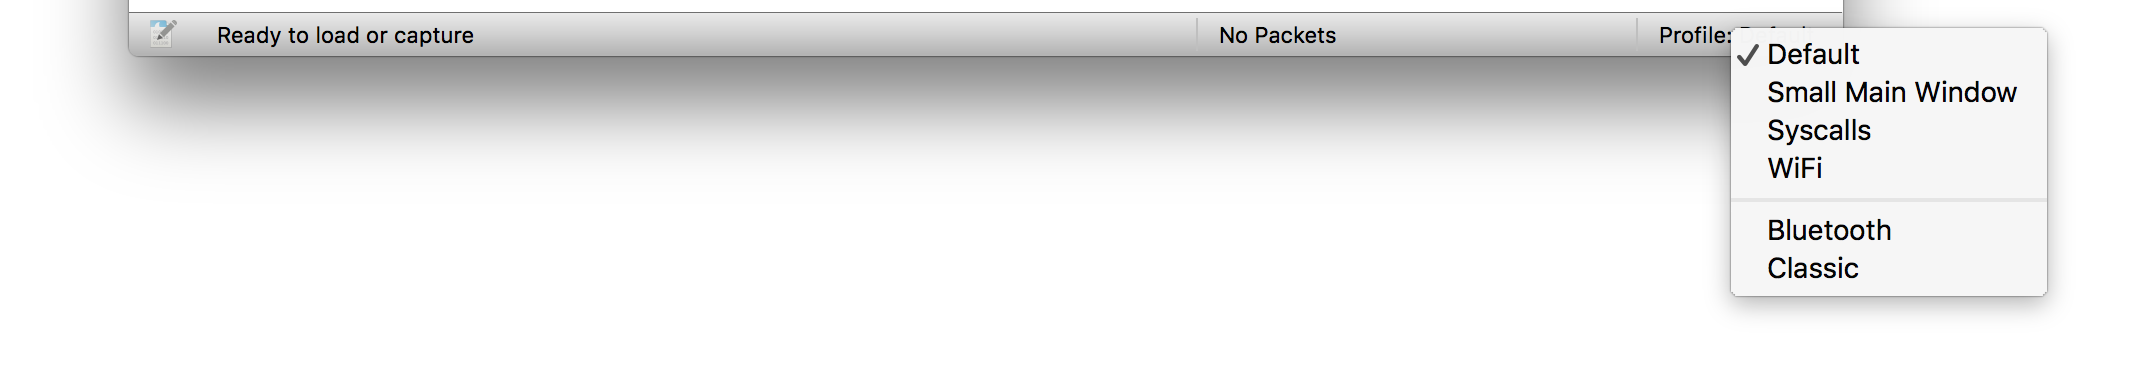
For a detailed description of configuration profiles, see Section 10.6, “Configuration Profiles”.

This is displayed if you have selected a protocol field from the “Packet Details” pane.
![[Tip]](tip.svg)
|
Tip |
|---|---|
|
The value between the parentheses (in this example ‘ipv6.src’) can be used as a display filter, representing the selected protocol field. |

This is displayed if you are trying to use a display filter which may have unexpected results. For a detailed description, see Section 6.4.6, “A Common Mistake”.