Wireshark can read in previously saved capture files. To read them, simply select the File → Open menu or toolbar item. Wireshark will then pop up the “File Open” dialog box, which is discussed in more detail in Section 5.2.1, “The “Open Capture File” dialog box”.
![[Tip]](tip.svg)
|
It’s convenient to use drag-and-drop |
|---|---|
|
You can open a file by simply dragging it in your file manager and dropping it onto Wireshark’s main window. However, drag-and-drop may not be available in all desktop environments. |
If you haven’t previously saved the current capture file you will be asked to do so to prevent data loss. This warning can be disabled in the preferences.
In addition to its native file format (pcapng), Wireshark can read and write capture files from a large number of other packet capture programs as well. See Section 5.2.2, “Input File Formats” for the list of capture formats Wireshark understands.
The “Open Capture File” dialog box allows you to search for a capture file containing previously captured packets for display in Wireshark. The following sections show some examples of the Wireshark “Open File” dialog box. The appearance of this dialog depends on the system. However, the functionality should be the same across systems.
Common dialog behaviour on all systems:
- Select files and directories.
- Click the Open or OK button to accept your selected file and open it.
- Click the Cancel button to go back to Wireshark and not load a capture file.
Wireshark extensions to the standard behaviour of these dialogs:
- View file preview information such as the filesize and the number of packets in a selected a capture file.
- Specify a display filter with the Filter button and filter field. This filter will be used when opening the new file. The text field background becomes green for a valid filter string and red for an invalid one. Clicking on the Filter button causes Wireshark to pop up the “Filters” dialog box (which is discussed further in Section 6.3, “Filtering packets while viewing”).
- Specify which type of name resolution is to be performed for all packets by clicking on one of the “… name resolution” check buttons. Details about name resolution can be found in Section 7.9, “Name Resolution”.
|
|
Save a lot of time loading huge capture files |
|---|---|
|
You can change the display filter and name resolution settings later while viewing the packets. However, loading huge capture files can take a significant amount of extra time if these settings are changed later, so in such situations it can be a good idea to set at least the filter in advance here. |
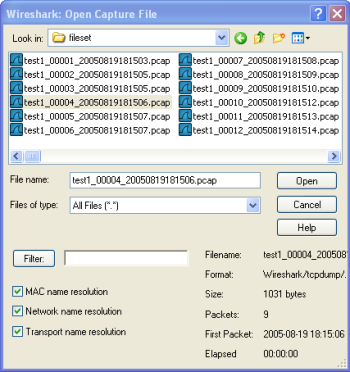
This is the common Windows file open dialog - plus some Wireshark extensions.
Specific for this dialog:
- The Help button will lead you to this section of this “User’s Guide”.
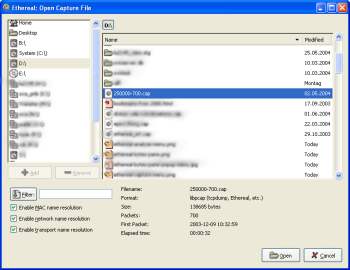
This is the common Gimp/GNOME file open dialog plus some Wireshark extensions.
Specific for this dialog:
- The + button allows you to add a directory selected in the right-hand pane to the favorites list on the left. These changes are persistent.
- The - button allows you to remove a selected directory from the list. Some items (such as “Desktop”) cannot be removed from the favorites list.
- If Wireshark doesn’t recognize the selected file as a capture file it will grey out the Open button.
The following file formats from other capture tools can be opened by Wireshark:
- pcapng. A flexible, etensible successor to the libpcap format. Wireshark 1.8 and later save files as pcapng by default. Versions prior to 1.8 used libpcap.
- libpcap. The default format used by the libpcap packet capture library. Used by tcpdump, _Snort, Nmap, Ntop, and many other tools.
- Oracle (previously Sun) snoop and atmsnoop
- Finisar (previously Shomiti) Surveyor captures
- Microsoft Network Monitor captures
- Novell LANalyzer captures
- AIX iptrace captures
- Cinco Networks NetXray captures
- Network Associates Windows-based Sniffer and Sniffer Pro captures
- Network General/Network Associates DOS-based Sniffer (compressed or uncompressed) captures
- AG Group/WildPackets/Savvius EtherPeek/TokenPeek/AiroPeek/EtherHelp/PacketGrabber captures
- RADCOM’s WAN/LAN Analyzer captures
- Network Instruments Observer version 9 captures
- Lucent/Ascend router debug output
- HP-UX’s nettl
- Toshiba’s ISDN routers dump output
- ISDN4BSD i4btrace utility
- traces from the EyeSDN USB S0
- IPLog format from the Cisco Secure Intrusion Detection System
- pppd logs (pppdump format)
- the output from VMS’s TCPIPtrace/TCPtrace/UCX$TRACE utilities
- the text output from the DBS Etherwatch VMS utility
- Visual Networks' Visual UpTime traffic capture
- the output from CoSine L2 debug
- the output from Accellent’s 5Views LAN agents
- Endace Measurement Systems' ERF format captures
- Linux Bluez Bluetooth stack hcidump -w traces
- Catapult DCT2000 .out files
- Gammu generated text output from Nokia DCT3 phones in Netmonitor mode
- IBM Series (OS/400) Comm traces (ASCII & UNICODE)
- Juniper Netscreen snoop captures
- Symbian OS btsnoop captures
- Tamosoft CommView captures
- Textronix K12xx 32bit .rf5 format captures
- Textronix K12 text file format captures
- Apple PacketLogger captures
- Captures from Aethra Telecommunications' PC108 software for their test instruments
New file formats are added from time to time.
It may not be possible to read some formats dependent on the packet types captured. Ethernet captures are usually supported for most file formats but it may not be possible to read other packet types such as PPP or IEEE 802.11 from all file formats.