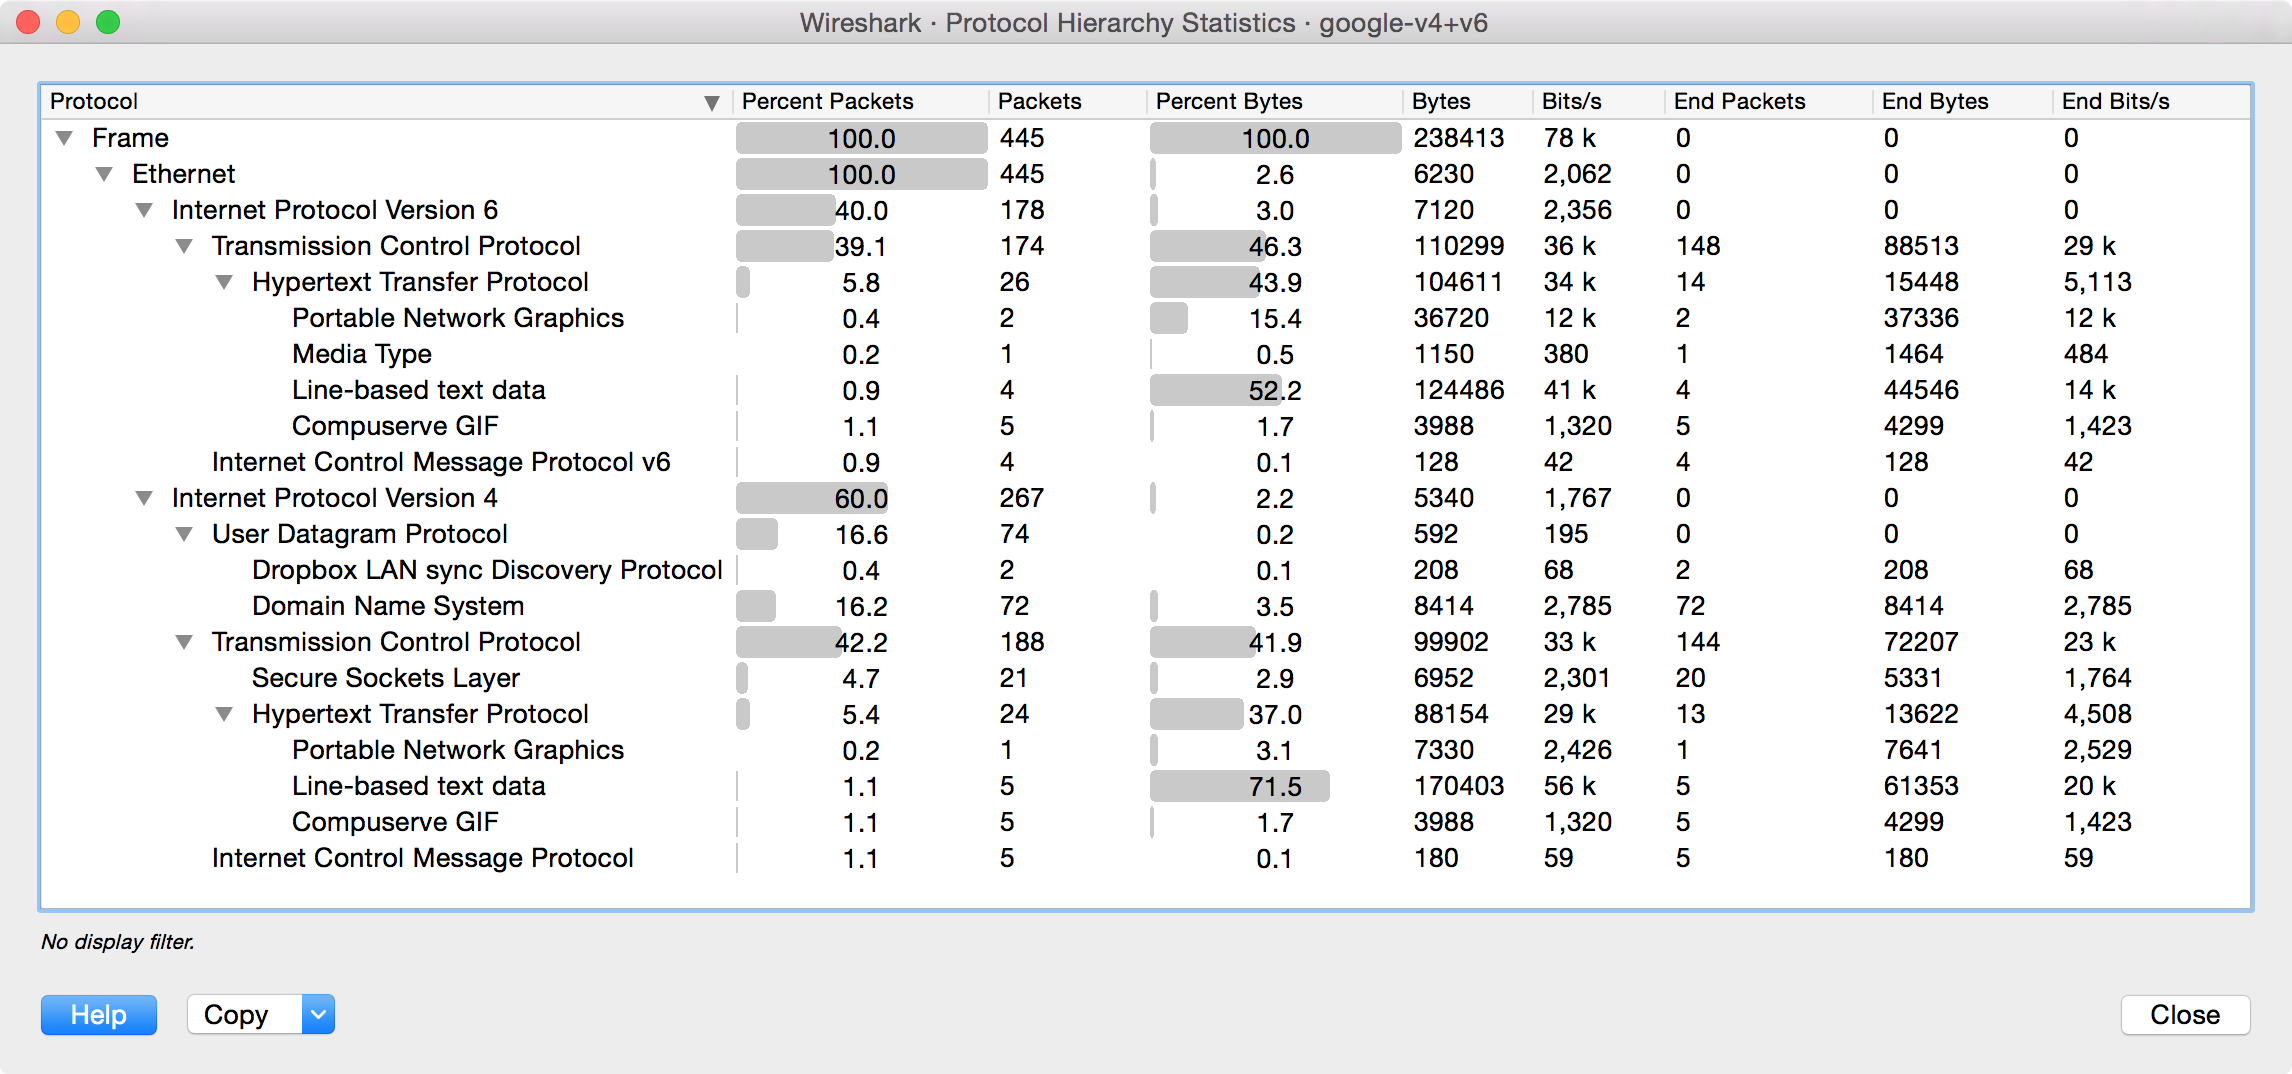
The protocol hierarchy of the captured packets.
This is a tree of all the protocols in the capture. Each row contains the statistical values of one protocol. Two of the columns (Percent Packets and Percent Bytes) serve double duty as bar graphs. If a display filter is set it will be shown at the bottom.
The Copy button will let you copy the window contents as CSV or YAML.
Protocol hierarchy columns
- Protocol
- This protocol’s name
- Percent Packets
- The percentage of protocol packets relative to all packets in the capture
- Packets
- The total number of packets of this protocol
- Percent Bytes
- The percentage of protocol bytes relative to the total bytes in the capture
- Bytes
- The total number of bytes of this protocol
- Bits/s
- The bandwidth of this protocol relative to the capture time
- End Packets
- The absolute number of packets of this protocol where it was the highest protocol in the stack (last dissected)
- End Bytes
- The absolute number of bytes of this protocol where it was the highest protocol in the stack (last dissected)
- End Bits/s
- The bandwidth of this protocol relative to the capture time where was the highest protocol in the stack (last dissected)
Packets usually contain multiple protocols. As a result more than one protocol will be counted for each packet. Example: In the screenshot IP has 99.9% and TCP 98.5% (which is together much more than 100%).
Protocol layers can consist of packets that won’t contain any higher layer protocol, so the sum of all higher layer packets may not sum up to the protocols packet count. Example: In the screenshot TCP has 98.5% but the sum of the subprotocols (SSL, HTTP, etc) is much less. This can be caused by continuation frames, TCP protocol overhead, and other undissected data.
A single packet can contain the same protocol more than once. In this case, the protocol is counted more than once. For example ICMP replies and many tunneling protocols will carry more than one IP header.
