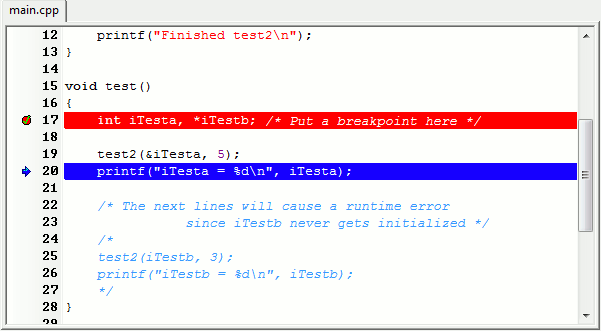
Stepping Through Your Program
Once a breakpoint has been reached, you can step into the code of your application in different ways :
- Next Step
 (shortcut : F7)
: The debugger will execute the next instruction (i.e. line
of code) and pause
- Step Into
 (shortcut : Shift+F7)
: The debugger will execute the next instruction
(i.e. line of code) and pause.
If that instruction is a function call it will jump into the function
and future steps will go line by line through that function until it
returns to the line that called it.
 - -exec-finish
 : The debugger will resume execution until the current function is exited.
 - Debug / Continue
 (shortcut : F8)
: The debugger will start or continue the execution of your program
until another breakpoint is reached.

If you keep hitting F7, the debugger will continue executing the program one line at a time until it reaches the end. Note that this is very useful in sections of your code where you think there may be logic errors or infinite loops. You can essentially slow the program execution down and view each instruction as it happens.