Debugging your program
Launching your program into the debugger is easy.Just go to the Debug menu and click on Debug (
If you do not have debugging information set in your project, wxDev-C++ will ask you if you want to rebuild your program with this information enabled. You can manually select that option in Compiler Option in the Linker section.
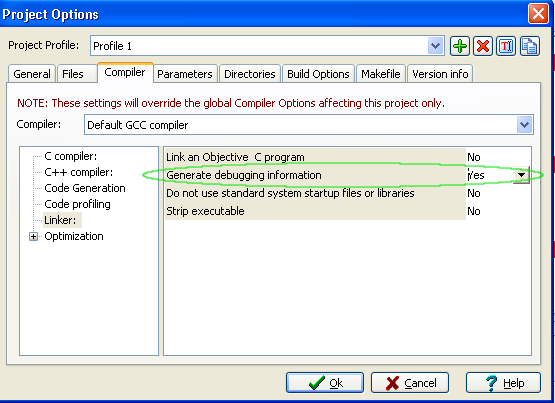
Note that the executable size has grown because the compiler has added additional information that the debugger accesses during runtime. After your project has been rebuilt with the debugger information included, you can click Debug again.
The debugger has now loaded your program and runs it.
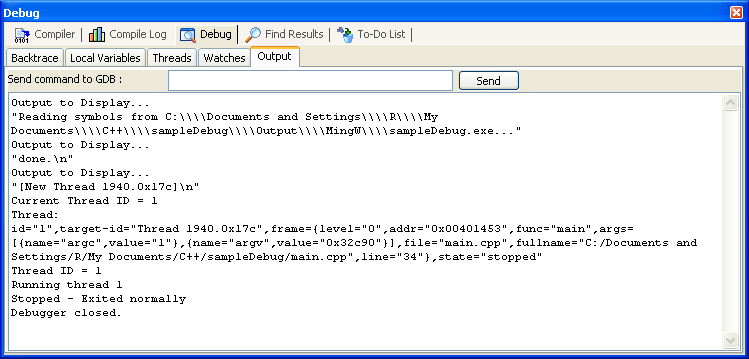
What happened? Well, as the Debugger Output window shows above, wxDev-C++ started gdb and ran your executable called "sampleDebug.exe". The program had no errors and no breakpoints and so it exited normally.
Since the program exited normally, this output is probably only interesting if you are familiar with gdb.
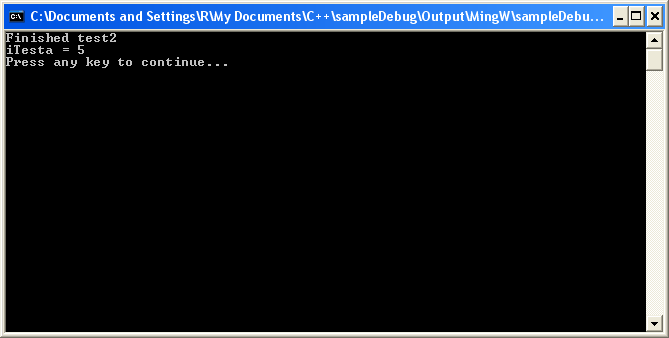
You will also have seen your program run in a console window like this
You can also send commands directly to the debugger by using the "Send command to GDB" edit box just above the output. If you do not know gdb, you can type help to display a list of commands.
You can see (almost) all of GDB's output by turning on Verbose Debugger Output in the Debug menu.
Remember that wxDev-C++ is really just running a shell that passes these commands to the debugger and reads the output returned. You could re-create the same commands by using gdb from within a DOS shell.
In the next sections, we'll cover several useful (and more interesting) aspects of the debugger :
- Breakpoints
- Stepping through your code
- Watch variables
- Backtracing
- Using the CPU Window