Elements of a PivotTable list

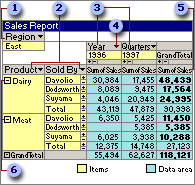
 Filter field
 Row fields
 Column field
 Field drop-down arrow
 Data field
 Expand Indicator
Each field corresponds to a column of data and can summarize multiple rows of information. Types of fields include row fields, column fields, data fields, detail fields, and filter fields.
A unique element of data within a field. Items of data in row and column fields are listed down rows and across columns. The cell where a row and column intersect displays summarized data for the items listed at the top of the column and the left side of the row. When a lower level of items is available for display, an expand indicator  appears beside the item. The items at the lowest level don't display expand indicators. The expand indicators (
 and
and  boxes) to the right of an item indicate that detail data is available for that item.
A field in the row area. In the above PivotTable list, Product and Sold By are row fields. Items in row fields are listed down the left side of a PivotTable list. Inner row fields, such as Sold By, are closest to the data area; outer row fields, such as Product, are to the left of the inner row fields.
A field in the column area. Items in column fields are listed across the top of a PivotTable list, above the data fields. In the above PivotTable list, Year is a column field with two items, 1996 and 1997. Inner column fields are closest to the data area; outer column fields are above the inner column fields.
A field in the filter area that you can use to filter the entire PivotTable list to display summarized data for specific items. In the above PivotTable list, Region is a filter field that you can use to display data for all regions or only selected regions. Filter fields perform the same functions as page fields in Microsoft Excel PivotTable reports.
A field that contains summary values from the source data. In the above PivotTable list, Sales is a data field that contains summarized sales amounts — each value in the data field is the sum of the entries from the Sales field or column in the source data.
A data field usually summarizes numeric data, such as statistics or sales amounts, by using the Sum summary function. In the above PivotTable list, the cell containing 30,984 displays Davolio's total sales for dairy products in 1996. This cell combines the sales amounts from every record in the source data that has Dairy for the product, Davolio for the salesperson, and 1996 for the year.
The underlying data can also be text, summarized by default with the Count summary function, which yields the number of items — for example, a data field that contains the type of product sold might be used to count the number of dairy sales that Davolio made in 1996. A PivotTable list can also summarize data by using the Min and Max summary functions, which give the smallest and largest values, respectively.
The part of a PivotTable list that contains data fields.
A field that displays all of the rows, or records, from the source data.
The part of a PivotTable list that contains detail fields.
The arrow  at the right side of each field. Click this arrow to display a list from which you can select the items to display and hide.
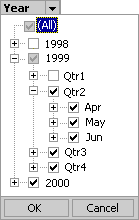
In PivotTable lists that are based on OLAP source data, you can select items at different levels in a dimension field. Date and time fields and fields with custom groups provide different levels in all types of source data. For example, clicking the arrow next to a Year field might display the following:

In this example, the cleared check box next to 1998 indicates that the year 1998 is hidden. The shaded check box next to 1999 indicates that the year 1999 is currently selected for display but some of the items under 1999 are not selected for display. Within 1999, Qtr1 is hidden. The selected check box next to 2000 indicates that the year 2000 is selected for display. Selecting (All) selects all items at all levels for display.

 Fields