Owning Palette: Filter Analysis VIs
Installed With: Digital Filter Design Toolkit
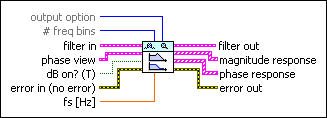
Plots the frequency responses, including the magnitude and phase responses, of a filter.

 Place on the block diagram Place on the block diagram |  Find on the Functions palette Find on the Functions palette |
 | output option specifies the filter response that this VI plots.
| ||||||
 | # freq bins specifies the number of frequency bins between 0 and fs that this VI plots in the frequency response. The default is –1, which specifies that this VI automatically determines the number of frequency bins. | ||||||
 | filter in specifies the input filter. | ||||||
 | phase view specifies the phase response display settings.
| ||||||
 | dB on? specifies whether this VI uses decibels or a linear scale to express the magnitude response. The default is TRUE, which specifies that this VI converts linear magnitude response to decibels. | ||||||
 | error in describes error conditions that occur before this VI or function runs.
The default is no error. If an error occurred before this VI or function runs, the VI or function passes the error in value to error out. This VI or function runs normally only if no error occurred before this VI or function runs. If an error occurs while this VI or function runs, it runs normally and sets its own error status in error out. Use the Simple Error Handler or General Error Handler VIs to display the description of the error code. Use error in and error out to check errors and to specify execution order by wiring error out from one node to error in of the next node.
| ||||||
 | fs specifies the sampling frequency in hertz. The default is –1, which specifies that this VI uses the sampling frequency of the input filter. | ||||||
 | filter out returns the filter in unchanged. | ||||||
 | magnitude response returns the magnitude response of the filter. | ||||||
 | phase response returns the phase response of the filter. | ||||||
 | error out contains error information. If error in indicates that an error occurred before this VI or function ran, error out contains the same error information. Otherwise, it describes the error status that this VI or function produces.
Right-click the error out front panel indicator and select Explain Error from the shortcut menu for more information about the error.
|
DFD Plot Freq Response Details
Given the transfer function of a filter H(z), the frequency response of the filter is defined by the following equation:
H(ejω) = H(z)|z = ejω
H(ejω) is a complex function that can be expressed using the following equation:
H(ejω) = |H(ejω)|ejθ(ω)
where |H(ejω)| is defined as the magnitude response, and θ(ω) is defined as the phase response.
If k is an integer, H(ej(ω+2kπ)) = H(ej2kπejω) = H(ejω), so H(ejω) is periodic with a period 2π. |H(ejω)| and θ(ω) also are periodic with a period 2π. For one period –π ≤ ω ≤ π, the magnitude response is even symmetric and the phase response is odd symmetric. The frequency response is calculated only for 0 ≤ ω ≤ π, meaning the frequency is between 0 and fs/2, where fs is the normalized sampling frequency.
Examples
Refer to the following VIs for examples of using the DFD Plot Freq Response VI:


