Resolving Locks
Performance Analysis provides users the ability to review and investigate locking and blocking behavior for a monitored instance. Lock investigation and analysis can be performed both in real-time using the Recent View, and for past locks using the History View. For instance, if a database administrator is alerted to locking problems on the server, he can immediately open a Performance Analysis console, and using the Recent View, begin to investigate the cause of the blocking. Once the problem is remedied, the DBA can use the History View to return to the point in time when the blocking behavior was identified to see what factors contributed to the problem.
Below are step-by-step instructions on how to review locking behavior using Performance Analysis.
Real-Time Analysis
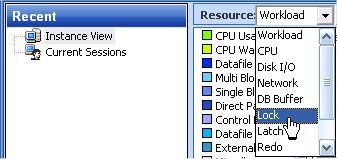
Click the Real-Time mode, to display the Recent tree Instance View node,
Directly to the right of the treeview, above the graphical workload timeline, change the Resource value to Lock:
Click the Blocking Locks tab to view the locking map. Use the displayed data to reveal lock and session parameters
Review the blocking locks. The sessions that are causing blocking problems are displayed in the list.
Click the plus sign (
 ) to the left of the blocking session to display the
locking map and reveal the BLOCKED processes (individual locks created
by the blocking session). Only locks which actually resulted in a block
are included. The lock icon (
) to the left of the blocking session to display the
locking map and reveal the BLOCKED processes (individual locks created
by the blocking session). Only locks which actually resulted in a block
are included. The lock icon ( ) indicates a currently active
lock.
) indicates a currently active
lock. Click on one of the numeric hyperlinks presented to view the specific session’s activity.
From within the Recent tree Current Sessions node, directly to the right of the treeview, above the graphical workload timeline, change the Resource value to Lock.
Individual user sessions are listed at the bottom of the screen. The Lock Wait column represents the cumulative time a given session has waited for a locked resource. Double-click one of the sessions showing lock activity.
After double-clicking a blocked/locked session, it is added to the left treeview under Current Sessions. You are now viewing information about the BLOCKED/LOCKED session. Click the right-most tab, Session Locks to display both blocking and expired locks.
Historical Behavior
A lock wait alarm (
 ) is generated either from the Home
mode Lock Oracle
Performance Resource Breakdown
or from the Performance Advisories
Locking metric.
) is generated either from the Home
mode Lock Oracle
Performance Resource Breakdown
or from the Performance Advisories
Locking metric. A one-click drilldown opens the History mode period with offending period and lock resource in focus.
Click the Blocking Locks tab to display detail about the sessions blocking this session. Just like the Recent view, the data displayed applies to the BLOCKED/LOCKED session. By default, Performance Analysis groups this information by the locked object.
Use the information provided under the Blocking Locks tab to begin investigating the SQL statements executing under those dimensions during the same time period. This helps you determine the cause of the locking. You can drill-down through several dimensions to collect useful information and further narrow your search, for key parameters, such as each session’s client machine, the executing program, the blocked SQL Statement, and the context information for the blocked session.