Change Tracking
From Performance Analysis for Oracle
Change Tracking tab
The change tracking tool is an integrated monitoring feature available only if the repository is installed. It periodically tracks changes in environments and activity that can potentially influence system performance and enables the user to correlate between occurrences of changes and Oracle's activity and behavior patterns. Use the Filter feature to refine the set of displayed change tracking occurrences.
In the following graphic, access the five callout text messages, aligned with the number pointers, by hovering the mouse over the area of interest:
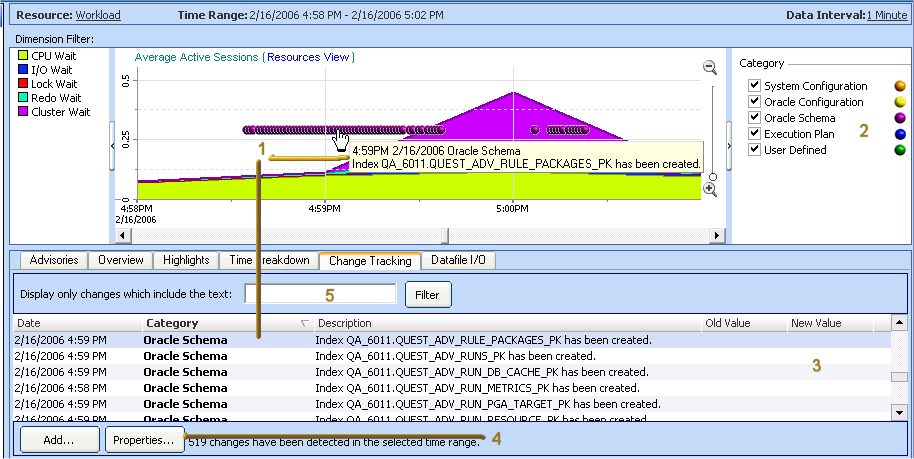
Note: Accessing change tracking from within a specific historical SQL dimension drilldown limits the displayed occurrences to only those relevant to that SQL. For example, you will be able to see only changes in tables, indexes and execution plan of that statement.
Oracle change categories:
System Configuration
Hardware and operating system configuration (for example, OS global parameters, disks and network interfaces (NIC); amount of RAM; CPU count; device installations and swap space allocation).
Oracle Configuration
Instance-level configuration: init.ora parameters; files (data, log and control) location, size and status; rollback segments; temporary table space.
Oracle Schema
Any schema object: Tables and indexes and their partitions and sub-partitions; clusters; constraints; views; materialized views; packages and types and their bodies; functions; procedures; and triggers (for example, altering a table; altering or rebuilding an index).
Execution Plan
StealthCollect captures SQL statements whose execution plans have changed. When an execution plan has (unintentionally) changed, the outcome can result in SQL performance degradation. Therefore it is essential you investigate the change, by clicking Properties to graphically display the execution plan before and after the change, to verify that the nature and outcome of the change improve SQL performance.
User Defined
Changes inserted by user. Use this feature to document occurrences of interest. For example, the System Administrator installed an operating system patch. Recording this activity can assist in determining whether a change in performance can be directly associated with this event.
Create user-defined change-tracking points by clicking Add and specifying the time and description in the subsequently displayed Add Change dialog.