Third-Order Intercept
Third-order intercept (TOI) point is a measurement of the degree of linearity of a system. TOI point is a calculated number derived from a two-tone intermodulation test. Typically, two tones of the same power level and of different frequencies are applied to the input of a device. When the signal is generated, the two desired tones appear with distortion products. These distortion products are a result of nonlinearities within the device. The following equation represents the input signals:
x(t)=A1Cos( 1t) + A2Cos(
 2t)
2t)
A nonlinear device has an output response that is expressed by the following equation:
y(t)= 1x(t) +
  2x2(t) +
  3x3(t) + ...
where
 x coefficients represent the gain and the degree of nonlinearity within the device
x2 terms represent the second-order distortion terms
x3 represents the third-order distortion terms
 1x(t)represents the desired output
Plugging x(t) into yt results in distortion factors shown in the following table:
| Frequency | Distortion Order | Typical Output Power Level |
|---|---|---|
| 0 (DC offset) | Second | 0.5 2(A12 + A22) 2(A12 + A22) |
2 1 1 |
Second | 0.5 2A12 2A12 |
2 2 2 |
Second | 0.5 2A22 2A22 |
 2– 2– 1 1 |
Second | 0.5 2A1A2 2A1A2 |
 2+ 2+ 1 1 |
Second | 0.5 2A1A2 2A1A2 |
3 1 1 |
Third | 0.25 3A13 3A13 |
3 2 2 |
Third | 0.25 3A23 3A23 |
 1 1 |
Third | 0.75 3A13 + 1.5A1A22 3A13 + 1.5A1A22 |
 2 2 |
Third | 0.75 3A23 + 1.5A2A12 3A23 + 1.5A2A12 |
2 2– 2– 1, 2 1, 2 2+ 2+ 1 1 |
Third | 0.75 3A1A22 3A1A22 |
2 1– 1– 2, 2 2, 2 1+ 1+ 2 2 |
Third | 0.75 3A2A12 3A2A12 |
The terms of most interest are 2 2–
2– 1 and 2
 1–
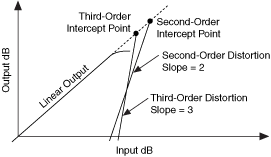
1– 2 because these terms are closer into the carrier and are more difficult to filter out. For broadband systems such as CATV, it is important to consider all the terms that fall within this bandwidth. A plot of the desired output signal frequency versus input power is shown in the following figure. Also shown in this plot are the second-order distortion level and the third-order distortion level power levels versus input power.

The output second-order intercept point (OIP2) and the output third-order intercept point (OIP3) occur where the second-order line and third-order line, respectively, intersect the desired output signal. If A1 is set equal to A2, and each value is increased by 1 dB, then the third-order distortion products increases 3 dB for every 1 dB increase in output power. The second-order distortion products increases 2 dB for every 1 dB increase in output power. Therefore, based on a two-tone intermodulation test, the output IP3 can be calculated using the following formula:
OIP3 = Pout (dBm) + .5IMD3rd(dBc)
OIP2 = Pout (dBm) + IMD2nd(dBc)
The TOI is dependent upon power levels. The following table summarizes typical RF signal generator performance.
| Frequency (MHz) | -20 dBm/tone | -6 dBm/tone | 5 dBm/tone |
|---|---|---|---|
100 | 86 dBc | 78 dBc | 54 dBc |
1000 | 86 dBc | 86 dBc | 54 dBc |
2000 | 86 dBc | 86 dBc | 50 dBc |
2700 | 86 dBc | 82 dBc | 46 dBc |
As the power output level increases, the TOI point increases, except for power levels above -3dBm/tone. Beyond -3dBm/tone, there is a step reduction in the TOI point, as shown in the preceding table. The second-order intercept point behaves in a similar manner. This step change above -3 dBm/tone is caused by the architecture and attenuator locations of the NI 5610 upconverter module.