|
The Python Interactive Interpreter
|
Previous Top Next |
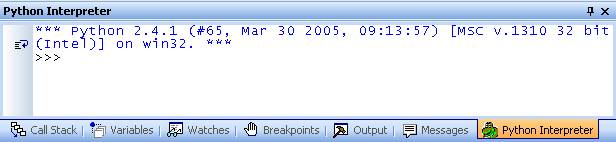
PyScripter provides an integrated interactive Python interpreter featuring command history,
code completion and call tips. This window also serves as the standard output of scripts
running within the IDE. During debugging and when the execution has stopped at a
breakpoint, the prompt changes to "[Dbg]>>> ".
Context Menu
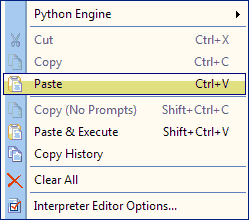
Copy (No Prompts)
Copies the selected text to the clipboard without the interpreter prompts.
Paste & Execute
Pastes text from the clipboard adding each contained statement to the prompt and interpreter
history and executing it.
Copy History
Copies the entered command history to the clipboard.
Clear All
Clear all interpreter output.
Interpreter Editor Options...
Shows the Editor Options Dialog (see the Editor Options topic for details) for the Interpreter
Window
Command History
· Alt-Up : previous command
· Alt-Down : next command
· Esc : clear command
If you scroll up and click on a previously issued command, possibly modified, then this
command is copied to the current prompt ready to be reissued. Copy and paste operations
work as in the text editor, but pieces of code need to be entered line-by-line.
New in Version 1.7.2.4
Command Filtering: If you type some characters in the Python prompt and then invoke the
history commands the history is filtered and only entries matching what you typed are shown.
New in Version 1.7.2.4
Up/Down Keys:
Up/Down keys can be used for the history previous/next commands, when the cursor is at the
last line of the interpreter and this line contains the Python prompt. In that case thought the
Up/Down keys are unavailable for scrolling, so you have to use the mouse to move to say the
previous line, beyond which the Up/Down keys work as normal.
Code Completion and Call Tips
Code completion and call tips are available when you type code in the interactive Python
interpreter window. Click here for details.
Traceback Information
Traceback information is displayed in red. By double clicking on a line with traceback call
stack information the corresponding file position is displayed in the editor if available.