The Call Stack Window
From PyScripter
|
The
Call Stack Window
|
Previous Top Next |
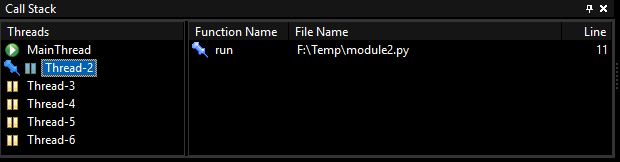
The call stack
window includes a list of active threads and displays the Python interpreter call stack while debugging. It
shows the function name and the corresponding source code position for each
stack frame. You can jump to a given code position by double-clicking
on a stack frame line.
The pinned
thread is the active "broken" thread and the pinned frame is the active
frame of the active thread. You should
note that the Call Stack window works in tandem with the
Variables
window,
which displays the local and global variables for the selected (active)stack frame in
this window. Initially the top stack frame is selected in the Call Stack window.
The
Watches
window evaluates watch expressions inside the active frame. Also
commands you issue in the
Interpreter window and debugger hints (hovering
the mouse on variable names in the editor) are also evaluated inside the
active frame. You can change the active thread and the active frame by
selecting with the mouse a different one.
Debugger commands
The Resume command (F9) resumes
execution of all broken threads. All other debug commands (e.g. Step in,
Step over, Step out) resume execution of the active thread only.
Commands:
Two commands
are provided to change the active stack frame using the keyboard and without
having to switch view to the Call Stack Window.
Previous
Frame
Select previous
(older) frame (default shortcut F11)
Next Frame
Select next
(newer) frame (default shortcut Shift+F11)