Defining Data Values
You can use the Define Signal dialog box to define a data value for a limit test.
To define a corner Data Point, click the Insert button below the table or enter the X and Y values in the table. The new point appears on the graph. You can change the position of a point by clicking the point on the graph and moving it. If you move any point past another data point, the table automatically reorders and increases the X column values.
You can rescale the entire limit signal by entering new values in the New min. and New max. fields in the Rescale limit section.
You can save the data points that define the limit to a file using the Save Data button. You also can load data points from a file using the Load Data button. LabVIEW SignalExpress uses the LabVIEW measurement .lvm format.
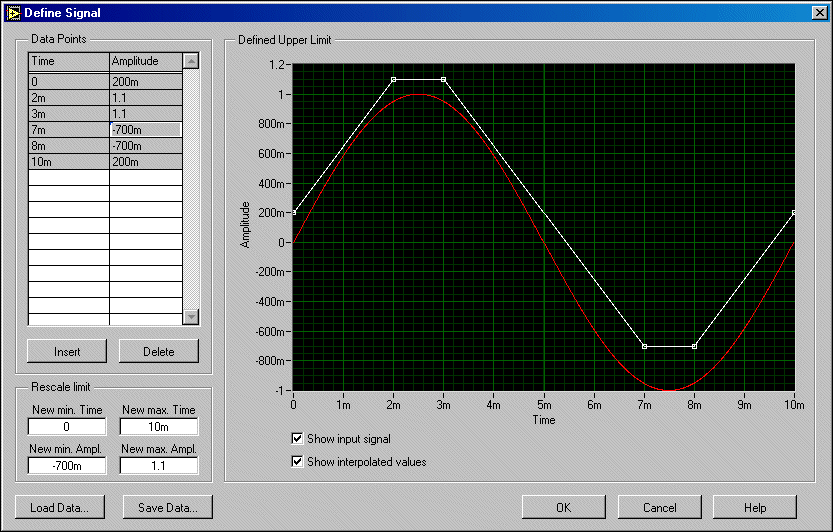
The following graphic is an example of using the Define Signal dialog box to define the upper limit of a time-domain signal.

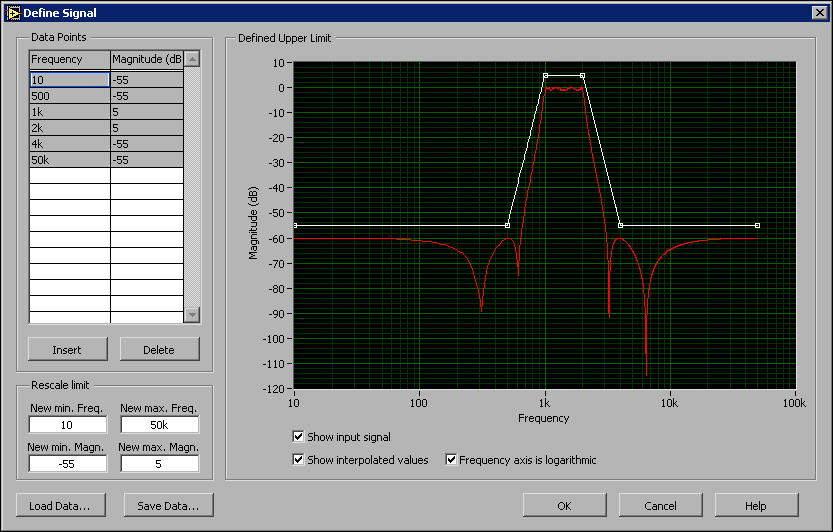
The following graphic is an example of using the Define Signal dialog box to define the upper limit of a frequency-domain signal using logarithmic frequency axis.
