Meaning of the Tables
For a Bayes or decision net to be fully specified, every nature and utility node must have a filled-in table. Each table expresses the value of the node in terms of its = 4 && typeof(BSPSPopupOnMouseOver) == 'function') BSPSPopupOnMouseOver(event);" class="BSSCPopup" onclick="BSSCPopup('X_PU_parent_node.htm');return false;">parents (or as a constant if the node has no parents). If the node is = 4 && typeof(BSPSPopupOnMouseOver) == 'function') BSPSPopupOnMouseOver(event);" class="BSSCPopup" onclick="BSSCPopup('X_PU_deterministic_node.htm');return false;">deterministic then the table will be a function which provides a value for the child for each possible configuration of parent values. If the node is probabilistic (i.e. a = 4 && typeof(BSPSPopupOnMouseOver) == 'function') BSPSPopupOnMouseOver(event);" class="BSSCPopup" onclick="BSSCPopup('X_PU_chance_node.htm');return false;">chance node), then the table will provide a probability for each state of the child, for each possible configuration of parent values.
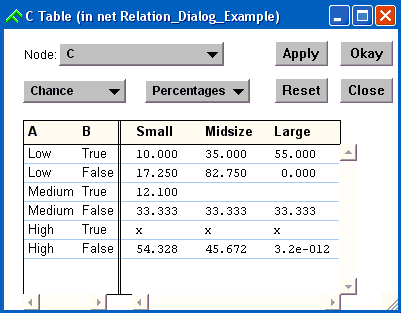
For example, suppose node A (which can take on values Low, Medium or High) and node B (which can take on values True or False) are the two parents of node C (which can take on values Small, Midsize or Large). It is best to think of the relation between them as being located at node C (the child), and its table dialog box might look something like this:

On the left-hand side is a vertical list of all the configurations of parent values. On the right-hand side is one column for each state of C. The numbers in the table provide conditional probabilities for the values of C, given that the parents take on the configuration of their row. For example, the 10.000 (percent) in the upper left corner means that P(C=Small | A=Low, B=True) = 0.1. The number 3.2e-12 at the bottom right means P(C=Large | A=High, B=False) = 3.2 x 10^-14.
Empty cells indicate probabilities that have not yet been specified. Examples are the two blank cells on the third row.
Cells with X indicate an impossible condition. For example the three x’s on the fifth row indicate that the designer believes that the condition A=High while B=True is impossible.