Interpreting Frequency and Time Response Data (Control Design and Simulation Module)
The frqrsp and timeresp MathScript classes contain functions that return frequency or time response data. The following explanation describes how to interpret the data these functions return.
These functions return matrices of real numbers. Each column of these matrices represents one input/output pair of the system model. Each row of these matrices represents the response at different frequencies or times. Therefore, each matrix element represents the response of a certain input-output pair at a certain frequency or time. These functions return a list of the frequencies or times used to evaluate the model.
Consider a multiple-input multiple-output (MIMO) model with two inputs three outputs. The first column is the data from input 1 and output 1. The second column is the data from input 1 and output 2. The third column is the data from input 1 and output 3. Because the model has only three outputs, the fourth column is the data from input 2 and output 1. This numbering continues as the column index numbers increase from left to right.
Using this same matrix, the first row is the data from the first frequency or time. The second row is the data from the second frequency or time. This numbering continues as the row index numbers increase from top to bottom.
 | Note This numbering applies to each output for functions with more than one output, such as the bode function. The bode function has two outputs, mag and phase. Each output is a separate matrix. |
Example: Viewing Step Response Data
The following code constructs a state-space model with two states, two inputs, and two outputs. The code also returns the step response data from 0 seconds to 1 second in 0.10 second intervals.
A = [-9, 8; -1, 0]
B = [-1, 0; 0, 1]
C = [0.70711, 0.70711; -0.70711, 0.70711]
D = 0
SysIn = ss(A, B, C, D)
[Y, T] = step(SysIn, [0:0.10:1])
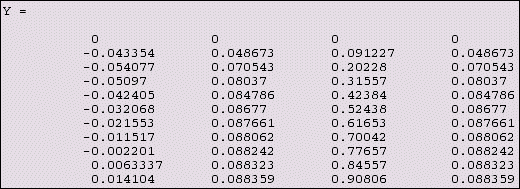
The following figure shows the Y output, which returns the step response for each input-output pair.

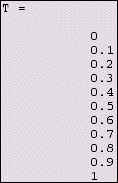
In the figure above, the first column is the step response of input 1/output 1, the second column is the step response of input 1/output 2, and so on. Each row of this matrix corresponds to a row of the T output, which returns the times at which this function evaluated the model. The following figure shows this output:

Using this information, the step response of input 2/output 1 at 0.2 seconds is 0.20228.