The audio display in VirtualDub displays a visualization of the audio track for spotting errant sounds and good editing points.
| Note | Currently, compressed audio streams cannot be displayed — only uncompressed (PCM) audio can be shown. An error will be displayed if the display is opened with a compressed audio stream. |
Opening the audio display
Select View > Audio Display from the menu to open the audio display. By default, the display opens in waveform mode, showing the sound wave from the audio track.
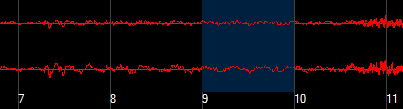
A waveform is shown for each channel in the audio track. The red line indicates the speaker position for each channel over time; it oscillates back and forth across the green centerline for normal sound, and a steady line that doesn't oscillate indicates quiet. The frame numbers are displayed at the bottom, and the gray lines next to them indicate the start of the video frame in time. The area highlighted in dark blue corresponds to the time during which the video frame is displayed.
The horizontal time scale can be changed by right-clicking on the display and selecting the Zoom in or Zoom out option from the resulting context menu. Zoom in to see the waveform in greater time resolution, and zoom out to see more of the waveform over time in the display.
Spectrogram mode
Right-click on the audio display to access the context menu, and you can switch the audio display to spectrogram mode. Although spectogram mode is slower to update than waveform mode, it is generally a more useful way to visualize a sound track.
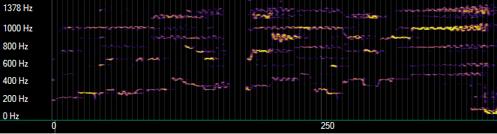
Spectrogram mode is different from waveform mode in that it shows frequency over time instead of amplitude. The frequency scale is shown on the left side, and the graph indicates the intensity of sound at each frequency. The higher the mark, the higher the frequency, and the brighter the mark, the louder the sound.
Keep in mind that a sound rarely shows up as a single, sharp blip — in practice, you will see a set of lines moving in parallel due to the harmonics of the sound, and for noise-like sounds, the image will show static. Constant horizontal lines indicate pure tones; if you see one low in the graph, it may be 50Hz or 60Hz power line hum leaking into the audio signal, indicating a possible grounding problem in your audio setup (a common problem).
If the sound track is low in volume, the graph may be somewhat dim and difficult to see. The Spectral Boost option in the right-click context menu allows the signal to be amplified, increasing the brightness of the graph.
Selecting frames
You can select video frames in the audio display by clicking with the left mouse button, similarly to how you can select a range by using the mark-in/out buttons on the position control.
- Hold down the Shift key and drag with the left mouse button to set the selection.
- The selection is displayed in light blue at the bottom of the display.
- To avoid clicks and pops when editing, choose endpoints where the sound is quietest. It is usually best to get as close as possible to a zero crossing where the waveform crosses the centerline. This is often difficult with multiple channels and only being able to cut on frame boundaries, but fortunately, you don't need a perfect cut for the jump to be inaudible.
Shifting audio
You can also shift the audio track back and forth from the audio display to fix audio sync errors.
- Identify a portion of the video clip where both the video frame and the audio waveform/spectrogram are distinctive.
- Hold down the Control key and click with the left mouse button on a portion of audio.
- Drag horizontally to when the audio should play.
- The audio display will now update with the new offset.
This changes the same setting as the audio displacement field of the Audio interleaving dialog.