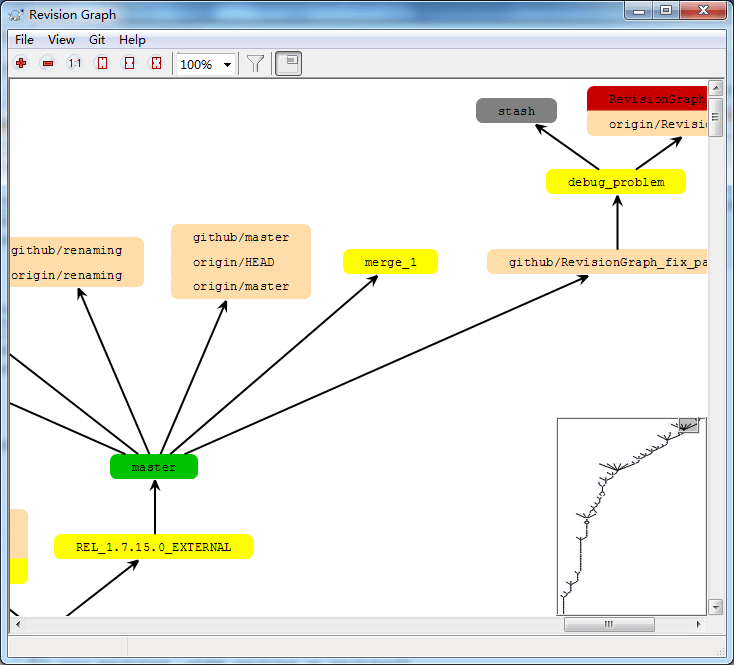
Sometimes you need to know where branches and tags were taken from the point, and the ideal way to view this sort of information is as a graph or tree structure. That's when you need to use →
This command analyses the revision history and attempts to create a direct graph showing the points at tag, branch and other reference.
![[Important]](important.png)
|
Important |
|---|---|
|
In order to generate the graph, TortoiseGit must fetch all log messages from the repository root. Just show commits which have some reference point to. |
Each revision graph node represents a revision in the repository where something changed in the tree you are looking at. Different types of nodes can be distinguished by colour which can be configured using →
Note that the graph only shows the points at which items were reference by tag, branch or the other ref. Showing every revision of a project will generate a very large graph for non-trivial cases.
To make it easier to navigate a large graph, use the overview window. This shows the entire graph in a small window, with the currently displayed portion highlighted. You can drag the highlighted area to change the displayed region.
The revision date, author and comments are shown in a hint box whenever the mouse hovers over a revision box.
If you select two revisions (Use Ctrl-left click), you can use the context menu to show the differences between these revisions. You can choose to show differences as at the branch creation points, but usually you will want to show the differences at the branch end points, i.e. at the HEAD revision.
You can view the differences as a Unified-Diff file, which shows all differences in a single file with minimal context. If you opt to → you will be presented with a list of changed files. Double click on a file name to fetch both revisions of the file and compare them using the visual difference tool.
If you right click on a revision you can use → to view the history.
