|
Charts
|
Previous Top Next |
 Assistant to build wikicode for graphs of different kinds.and insert it into pages.
|
|
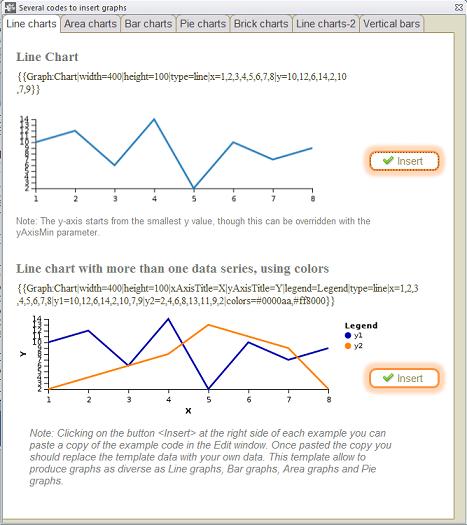
The Assistant for graphs is a tool to insert wikicode producing graph into your wikitext
pages disregarding the use of any image. All you have to do after inserting the desired
code in the Edit window, is to change the given values by your own data values. The
assistant offers graphs of different kinds:
· For one data series
· For multiple data series (with legend)
· For one data series
· For multiple data series showing blended overlap (with legend)
· For multiple data series with smoothed data values (with legend)
· For one data series
· For multiple data series (with legend)
· For multiple data series with stacked data series (with legend)
· Pie chart (not showing values)
· Pie chart (showing values)
· Pie chart with sectors of different radius (showing values)
· Pie chart in a form of a circular crown (ring)
|