MT Demodulate AM VI

LabView Analog Modulation

MT Demodulate AM VI

Demodulates an amplitude-modulated signal specified by the AM modulated waveform parameter, with optional suppression of the carrier wave. The demodulated signal is returned in the AM demodulated waveform parameter.

Use the pull-down menu to select an instance of this VI.

MT Demodulate AM (DSB)

This polymorphic instance demodulates a double sideband (DSB) amplitude-modulated signal. Demodulation proceeds according to one of the following methods, depending on whether suppressed carrier? is set to TRUE or FALSE:

  • suppressed carrier? = FALSE

    The incoming baseband AM-DSB modulated signal r(t) can be expressed by the following equations:

    r(t) = s DSB (t) e jφ(t),

    where s DSB (t) is a DSB modulated waveform and φ(t) is any time-varying phase ambiguity. AM-DSB demodulation involves performing envelope detection. The AM demodulated waveform (t) is given by the following equation:

    where k represents the modulation index.

  • suppressed carrier? = TRUE

    The incoming baseband AM-DSBSC modulated signal r(t) can be expressed as the following equations:

    r(t) = s DSBSC (t) e jφ(t),

    where s DSBSC (t) is an AM-DSBSC modulated waveform, and φ(t) is any time-varying phase ambiguity.

    The VI squares the signal r(t) when computing the phase estimate of φ(t). This squaring operation removes the 180° phase ambiguity relative to the sign of m(t). The computed phase estimate is used to generate a complex tone that is added back to the input signal r(t) to generate the equivalent DSB signal with carrier and unity modulation index. Thereon, envelope detection is performed for computing the AM demodulated waveform output (t).

    The recovered message signal (t) can be obtained from the following relationships:

MT Demodulate AM (DSB)

ccclst.gif

AM modulated waveform specifies the AM-DSB-modulated complex baseband time-domain data for demodulation.

cdbl.gif

t0 specifies the trigger (start) time of the Y array. The default is 0.00.

cdbl.gif

dt specifies time interval between data points in the Y array. The default is 1.00.

c1dcdb.gif

Y specifies the complex-valued time-domain data array. The real and imaginary parts of this complex data array correspond to the in-phase (I) and quadrature-phase (Q) data, respectively.

cdbl.gif

modulation index specifies the expected modulation index of the AM demodulated waveform parameter. This value is used to scale the AM demodulated waveform parameter. The default is 1.00.

  • Set this value to the estimated modulation index of the incoming AM modulated waveform signal to scale the AM demodulated waveform parameter by this value. The resulting scaled AM demodulated waveform can be used to quantify error between the actual and expected modulation index.
  • Set this value to 1.0 (the default) to return an AM demodulated waveform with no scaling. When suppressed carrier? is set to FALSE (the default), the peak amplitude value of the unscaled AM demodulated waveform represents the true modulation index of the incoming AM modulated waveform. If the message signal is a single tone, you can use the LabVIEW Extract Single Tone Information VI to measure the maximum amplitude of the AM demodulated waveform.
Note  This parameter is ignored when suppressed carrier? is set to TRUE.
cbool.gif

suppressed carrier? specifies whether the carrier has been suppressed in the incoming AM-DSB-modulated waveform. The default is FALSE.

ccclst.gif

error in (no error) accepts error information wired from previously called VIs. Use this information to decide if any functionality should be bypassed in the event of errors from other VIs. Right-click the front panel error in control and select Explain Error or Explain Warning from the shortcut menu for more information about the error displayed.

cbool.gif

status is either TRUE (X) for an error, or FALSE (checkmark) for no error or a warning. Right-click the front panel error in control and select Explain Error or Explain Warning from the shortcut menu for more information about the error displayed.

ci32.gif

code identifies the error or warning. Right-click the front panel error in control and select Explain Error or Explain Warning from the shortcut menu for more information about the error displayed.

cstr.gif

source describes the origin of the error or warning. Right-click the front panel error in control and select Explain Error or Explain Warning from the shortcut menu for more information about the error displayed.

iwfm.gif

AM demodulated waveform returns the recovered message signal.

Note  Wire the AM demodulated waveform parameter to any LabVIEW waveform measurement VI for further analysis. If the information signal is a single tone (normalized) and modulation index is set to 1.0 with suppressed carrier? set to FALSE, the peak amplitude value of the AM-demodulated waveform represents the true modulation index of the incoming AM-modulated waveform.
idbl.gif

t0 returns the trigger (start) time of the Y array.

idbl.gif

dt returns the time between values in the Y array.

i1dcdb.gif

Y returns the amplitude-demodulated recovered message signal array.

idbl.gif

carrier amplitude returns the mean zero-to-peak amplitude of the IF carrier wave in volts.

icclst.gif

error out passes error or warning information out of a VI to be used by other VIs. Right-click the front panel error out indicator and select Explain Error or Explain Warning from the shortcut menu for more information about the error displayed.

ibool.gif

status is either TRUE (X) for an error, or FALSE (checkmark) for no error or a warning. Right-click the front panel error in control and select Explain Error or Explain Warning from the shortcut menu for more information about the error displayed.

ii32.gif

code identifies the error or warning. Right-click the front panel error in control and select Explain Error or Explain Warning from the shortcut menu for more information about the error displayed.

istr.gif

source describes the origin of the error or warning. Right-click the front panel error in control and select Explain Error or Explain Warning from the shortcut menu for more information about the error displayed.

MT Demodulate AM (SSB)

This polymorphic instance demodulates a single sideband (SSB) amplitude-modulated signal. The AM-SSB demodulation procedure uses the transmitted pilot tone e pilot t as a reference for performing coherent demodulation.
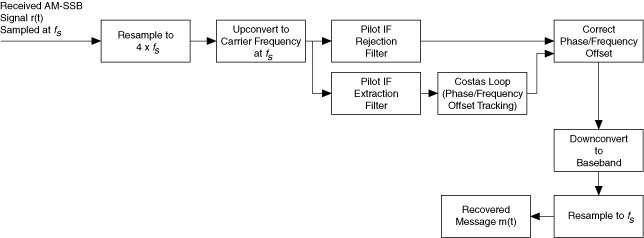
During the process of AM-SSB demodulation, the received AM-SSB signal (assumed to be sampled at the sampling frequency f s) is first resampled to a new sampling frequency equaling 4f s. The resampled AM-SSB modulated baseband waveform is then upconverted to an intermediate frequency (IF) passband waveform at a carrier frequency of f s. The IF passband waveform is passed through a real IF pilot tone extraction filter and a real IF pilot tone rejection filter. The extracted pilot tone at the output of the IF pilot tone extraction filter is passed through a carrier phase and frequency offset estimator to estimate the channel impairments. The estimated carrier phase and frequency offset corrections are applied to the extracted AM-SSB modulated signal-only component at the output of the pilot tone rejection filter. The resulting recovered message signal is obtained after downconversion and resampling to the input sampling rate f s.

MT Demodulate AM (SSB)

ccclst.gif

AM modulated waveform specifies the AM-SSB-modulated complex baseband time-domain data for demodulation.

cdbl.gif

t0 specifies the trigger (start) time of the Y array. The default is 0.00.

cdbl.gif

dt specifies time interval between data points in the Y array. The default is 1.00.

c1dcdb.gif

Y specifies the complex-valued time-domain data array. The real and imaginary parts of this complex data array correspond to the in-phase (I) and quadrature-phase (Q) data, respectively.

cdbl.gif

modulation index specifies the expected modulation index of the AM demodulated waveform parameter. This value is used to scale the AM demodulated waveform parameter. The default is 1.00.

  • Set this value to the estimated modulation index of the incoming AM modulated waveform signal to scale the AM demodulated waveform parameter by this value. The resulting scaled AM demodulated waveform can be used to quantify error between the actual and expected modulation index.
  • Set this value to 1.0 (the default) to return an AM demodulated waveform with no scaling. When suppressed carrier? is set to FALSE (the default), the peak amplitude value of the unscaled AM demodulated waveform represents the true modulation index of the incoming AM modulated waveform. If the message signal is a single tone, you can use the LabVIEW Extract Single Tone Information VI to measure the maximum amplitude of the AM demodulated waveform.
Note  This parameter is ignored when suppressed carrier? is set to TRUE.
cnclst.gif

pilot extraction filter specifies parameters used to locate the pilot tone and extract it from the specified AM modulated signal. The VI designs a bandpass filter for locating the pilot tone, and a band-reject filter for removing the pilot tone from the recovered signal, in a normalized frequency range:

[dt × approx freq - 0.01 × search (±% of Fsampl)

dt × approx freq + 0.01 × search (±% of Fsampl)]

where Fsampl is the sampling rate of the input AM modulated waveform.

Note   Carrier frequency offset can change the location of the pilot tone in the input AM modulated waveform. In such a case, specify a value for search (+/-% of Fsampl) large enough that the demodulator can locate the pilot tone in the presence of carrier frequency offset. For example, assuming a sample rate of 1.00 S/s, a pilot tone at 0.01 Hz, and a carrier frequency offset of 0.03 Hz, specify the following parameters for the pilot extraction filter cluster:
  • taps: 81
  • approx freq: 0.01
  • search (± % of Fsampl): 5
ci32.gif

taps specifies the number of taps used to design the pilot tone extraction filter. The default is 81.

cdbl.gif

approx freq. specifies the estimated frequency, in hertz, of the pilot tone in the input AM modulated waveform. The default value is 0.

cdbl.gif

search (+/- % of Fsampl) specifies the search window size as a percentage of the input sample rate 1/dt. To avoid erroneous detection of the pilot tone, ensure that this search window does not include any portion of the message spectrum. The default is 0.25.

cnclst.gif

costas loop parameters specifies optional parameters controlling the Costas loop. Usually Beta is chosen to be less than 0.02 × Alpha. These parameters are used in tracking carrier phase offset in the specified AM modulated waveform. The default settings are typically unchanged except in the presence of severely time-varying carrier phase offset.

cdbl.gif

Alpha specifies the α parameter as required by the Costas loop design. The default is 1 m.

cdbl.gif

Beta specifies the β parameter as required by the Costas loop design. The default is 20 u.

cbool.gif

suppressed carrier? specifies whether the carrier has been suppressed in the incoming AM-SSB-modulated waveform. The default is FALSE.

cbool.gif

reset? specifies whether the VI continues AM-SSB demodulation using internal states from previous iterations.

TRUE

When reset? is TRUE, the VI redesigns the pilot extraction filter and clears the internal filter states on each call. This is the default value.

FALSE When reset? is FALSE, the pilot extraction filter design is unchanged across multiple calls, and the internal filter state is set to ensure continuous filter operation.
ccclst.gif

error in (no error) accepts error information wired from previously called VIs. Use this information to decide if any functionality should be bypassed in the event of errors from other VIs. Right-click the front panel error in control and select Explain Error or Explain Warning from the shortcut menu for more information about the error displayed.

cbool.gif

status is either TRUE (X) for an error, or FALSE (checkmark) for no error or a warning. Right-click the front panel error in control and select Explain Error or Explain Warning from the shortcut menu for more information about the error displayed.

ci32.gif

code identifies the error or warning. Right-click the front panel error in control and select Explain Error or Explain Warning from the shortcut menu for more information about the error displayed.

cstr.gif

source describes the origin of the error or warning. Right-click the front panel error in control and select Explain Error or Explain Warning from the shortcut menu for more information about the error displayed.

iwfm.gif

AM demodulated waveform returns the recovered message signal.

Note  Wire the AM demodulated waveform parameter to any LabVIEW waveform measurement VI for further analysis. If the information signal is a single tone (normalized) and modulation index is set to 1.0 with suppressed carrier? set to FALSE, the peak amplitude value of the AM-demodulated waveform represents the true modulation index of the incoming AM-modulated waveform.
idbl.gif

t0 returns the trigger (start) time of the Y array.

idbl.gif

dt returns the time between values in the Y array.

i1dcdb.gif

Y returns the amplitude-demodulated recovered message signal array.

inclst.gif

measurements returns the pilot tone location, carrier offset, and phase offset.

idbl.gif

extracted pilot tone returns the location of the pilot tone in the AM modulated waveform frequency spectrum.

idbl.gif

frequency offset returns the measured carrier frequency offset in hertz of the specified AM modulated waveform.

icclst.gif

error out passes error or warning information out of a VI to be used by other VIs. Right-click the front panel error out indicator and select Explain Error or Explain Warning from the shortcut menu for more information about the error displayed.

ibool.gif

status is either TRUE (X) for an error, or FALSE (checkmark) for no error or a warning. Right-click the front panel error in control and select Explain Error or Explain Warning from the shortcut menu for more information about the error displayed.

ii32.gif

code identifies the error or warning. Right-click the front panel error in control and select Explain Error or Explain Warning from the shortcut menu for more information about the error displayed.

istr.gif

source describes the origin of the error or warning. Right-click the front panel error in control and select Explain Error or Explain Warning from the shortcut menu for more information about the error displayed.

MT Demodulate AM (VSB)

This polymorphic instance demodulates a vestigial sideband (VSB) amplitude-modulated signal. The AM-VSB demodulation procedure uses the transmitted pilot tone e pilot t as a reference for performing coherent demodulation.
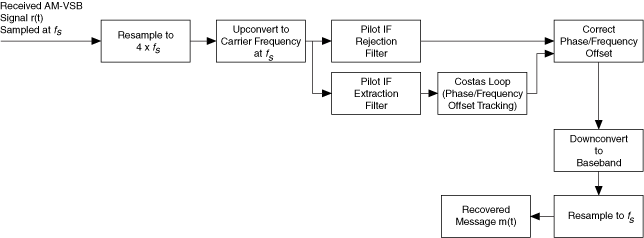
During the process of AM-VSB demodulation, the received AM-VSB signal (assumed to be sampled at the sampling frequency f s) is first resampled to a new sampling frequency equaling 4f s. The resampled AM-VSB modulated baseband waveform is then upconverted to an intermediate frequency (IF) passband waveform at a carrier frequency of f s. The IF passband waveform is passed through a real IF pilot tone extraction filter and a real IF pilot tone rejection filter. The extracted pilot tone at the output of the IF pilot tone extraction filter is passed through a carrier phase and frequency offset estimator to estimate the channel impairments. The estimated carrier phase and frequency offset corrections are applied to the extracted AM-VSB modulated signal-only component at the output of the pilot tone rejection filter. The resulting recovered message signal is obtained after downconversion and resampling to the input sampling rate f s.

MT Demodulate AM (VSB)

ccclst.gif

AM modulated waveform specifies the AM-VSB-modulated complex time-domain data for demodulation.

Note  Wire the AM demodulated waveform parameter to any LabVIEW waveform measurement VI for further analysis. If the information signal is a single tone (normalized) and modulation index is set to 1.0 with suppressed carrier? set to FALSE, the peak amplitude value of the AM demodulated waveform represents the true modulation index of the incoming AM modulated waveform.
cdbl.gif

t0 specifies the trigger (start) time of the Y array. The default is 0.00.

cdbl.gif

dt specifies time interval between data points in the Y array. The default is 1.00.

c1dcdb.gif

Y specifies the complex-valued time-domain data array. The real and imaginary parts of this complex data array correspond to the in-phase (I) and quadrature-phase (Q) data, respectively.

cdbl.gif

modulation index specifies whether to scale the AM demodulated waveform. The default is 1.00.

  • Set this value to the estimated modulation index of the incoming AM modulated waveform signal to scale the AM demodulated waveform output by this value. The resulting scaled AM demodulated waveform can be used to quantify error between the actual and expected modulation index.
  • Set this value to 1.0 (default) to return an AM demodulated waveform with no scaling. When suppressed carrier? is set to FALSE (default), the peak amplitude value of the unscaled AM demodulated waveform represents the true modulation index of the incoming AM modulated waveform. If the message signal is a single tone, you can use the LabVIEW Extract Single Tone Information VI to measure the maximum amplitude of the AM demodulated waveform.
Note  This input is ignored when suppressed carrier? is set to TRUE.
cnclst.gif

pilot extraction filter specifies parameters used to locate the pilot tone and extract it from the specified AM modulated signal. The VI designs a bandpass filter for locating the pilot tone, and a band-reject filter for removing the pilot tone from the recovered signal, in a normalized frequency range:

[dt × approx freq - 0.01 × search (±% of Fsampl)

dt × approx freq + 0.01 × search (±% of Fsampl)]

where Fsampl is the sampling rate of the input AM modulated waveform.

Note   Carrier frequency offset can change the location of the pilot tone in the input AM modulated waveform. In such a case, specify a value for search (+/-% of Fsampl) large enough that the demodulator can locate the pilot tone in the presence of carrier frequency offset. For example, assuming a sample rate of 1.00 S/s, a pilot tone at 0.01 Hz, and a carrier frequency offset of 0.03 Hz, specify the following parameters for the pilot extraction filter cluster:
  • taps: 81
  • approx freq: 0.01
  • search (± % of Fsampl): 5
ci32.gif

taps specifies the number of taps used to design the pilot tone extraction filter. The default is 81.

cdbl.gif

approx freq. specifies the estimated frequency, in hertz, of the pilot tone in the input AM modulated waveform. The default value is 0.

cdbl.gif

search (+/- % of Fsampl) specifies the search window size as a percentage of the input sample rate 1/dt. To avoid erroneous detection of the pilot tone, ensure that this search window does not include any portion of the message spectrum. The default is 0.25.

cnclst.gif

costas loop parameters specifies optional parameters controlling the Costas loop. Usually Beta is chosen to be less than 0.02 × Alpha. These parameters are used in tracking carrier phase offset in the specified AM modulated waveform. The default settings are typically unchanged except in the presence of severely time-varying carrier phase offset.

cdbl.gif

Alpha specifies the α parameter as required by the Costas loop design. The default is 1 m.

cdbl.gif

Beta specifies the β parameter as required by the Costas loop design. The default is 20 u.

cbool.gif

suppressed carrier? specifies whether the carrier has been suppressed in the incoming AM-VSB-modulated waveform. The default is FALSE.

cbool.gif

reset? specifies whether the VI continues AM-VSB demodulation using internal states from previous iterations

TRUE

When reset? is TRUE, the VI redesigns the pilot extraction filter and clears the internal filter states on each call. This is the default value.

FALSE

When reset? is FALSE, the pilot extraction filter design is unchanged across multiple calls, and the internal filter state is set to ensure continuous filter operation.

ccclst.gif

error in (no error) accepts error information wired from previously called VIs. Use this information to decide if any functionality should be bypassed in the event of errors from other VIs. Right-click the front panel error in control and select Explain Error or Explain Warning from the shortcut menu for more information about the error displayed.

cbool.gif

status is either TRUE (X) for an error, or FALSE (checkmark) for no error or a warning. Right-click the front panel error in control and select Explain Error or Explain Warning from the shortcut menu for more information about the error displayed.

ci32.gif

code identifies the error or warning. Right-click the front panel error in control and select Explain Error or Explain Warning from the shortcut menu for more information about the error displayed.

cstr.gif

source describes the origin of the error or warning. Right-click the front panel error in control and select Explain Error or Explain Warning from the shortcut menu for more information about the error displayed.

iwfm.gif

AM demodulated waveform returns the recovered message signal.

Note  Wire the AM demodulated waveform parameter to any LabVIEW waveform measurement VI for further analysis. If the information signal is a single tone (normalized) and modulation index is set to 1.0 with suppressed carrier? set to FALSE, the peak amplitude value of the AM-demodulated waveform represents the true modulation index of the incoming AM-modulated waveform.
idbl.gif

t0 returns the trigger (start) time of the Y array.

idbl.gif

dt returns the time between values in the Y array.

i1dcdb.gif

Y returns the amplitude-demodulated recovered message signal array.

inclst.gif

measurements returns the pilot tone location, carrier offset, and phase offset.

idbl.gif

extracted pilot tone returns the location of the pilot tone in the AM modulated waveform frequency spectrum.

idbl.gif

frequency offset returns the measured carrier frequency offset in hertz of the specified AM modulated waveform.

icclst.gif

error out passes error or warning information out of a VI to be used by other VIs. Right-click the front panel error out indicator and select Explain Error or Explain Warning from the shortcut menu for more information about the error displayed.

ibool.gif

status is either TRUE (X) for an error, or FALSE (checkmark) for no error or a warning. Right-click the front panel error in control and select Explain Error or Explain Warning from the shortcut menu for more information about the error displayed.

ii32.gif

code identifies the error or warning. Right-click the front panel error in control and select Explain Error or Explain Warning from the shortcut menu for more information about the error displayed.

istr.gif

source describes the origin of the error or warning. Right-click the front panel error in control and select Explain Error or Explain Warning from the shortcut menu for more information about the error displayed.