About adding and removing fields
When you add data to a chart that is based on database data or on a PivotTable list, you select fields from the source data for display in the chart.
 Viewing the fields available to the chart
Use the chart field list to view the list of fields that are available from the source data and to add fields to the category, series, filter, and data areas of the chart. In the field list, a fieldset contains one or more fields. The fields or fieldsets that are not bold are available to be displayed in the chart. Fieldsets that are bold contain one or more fields that are already displayed. You can scroll and click the expand indicators ( or
or  boxes) to show or hide additional fields in each fieldset. If you display multiple fields from the same fieldset, the fields must be displayed in the same drop area.
If your chart is based on source data from an OLAP database, such as one created by using Microsoft SQL Server OLAP Services, you'll notice that some fields can be moved only to the series or category areas. Other fields, listed under Totals, can be used only as data fields.
 Adding fields to the category or series area
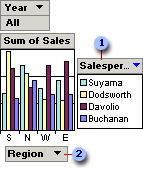
Use category and series fields to summarize and compare data. These fields display the unique items of data within a field as either a series (related data points) or category (related groups that consist of one point from each series).

 Series field, shown with legend. The names within the legend are items within the field.
 Category field. The names shown across the bottom of the x axis are items within the category field.
 Adding fields to the data area
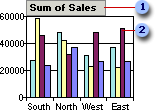
Data fields provide the values to be summarized in the chart. When you add a field to the data area, the values from the field are displayed as data markers for the category and series items.

 Data field
 Data markers that represent data points
 Adding fields to the filter area
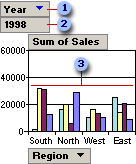
A filter field is similar to a page field in a Microsoft Excel PivotTable report. Use filter fields to confine the view to a particular part of the available data. When you select an item in a filter field, data is displayed and calculated only for that item. For example, if you add a Year filter field, you can have the chart display data for all years or for just one year at a time.

 Filter field
 Filter field item that is currently displayed
 Data markers for the selected year
You can create new data fields by adding total fields to the chart. Total fields provide summarized data for use as data fields. For example, if your source data includes a Sales field that shows the amount of each sale, you could add a Sum of Sales total field to calculate the total sales, or change a total field to a Count of Sales field to display how many units were sold.
To eliminate data that you don't want to see or summarize, you can remove fields from the chart. A field that you remove is no longer displayed in the chart, but it remains available in the field list for viewing.
After you add a field to a chart, you can move it to other areas. Moving a field changes the layout of the chart and the way the data is displayed.
 Impact of adding and removing fields on filtering
Filter settings are retained when you remove a field and add it back later.
