


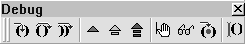
The Debug toolbar contains several tools you will employ as you work through this section. By default, this toolbar is attached to the View and Tools toolbars, and appears as a single VLISP toolbar.
The Debug toolbar is the left-most set of icons. Most of the items on the toolbar are inactive until you run your program in debugging mode (that is, with one or more breakpoints defined).
If you haven't done so already, detach the Debug toolbar from its position at the top of the screen. To do this, grab and drag it by the two vertical grips at the left of the toolbar. You can detach any of the VLISP toolbars and position them on your screen where they are most effective for your style of work.
The Debug toolbar is divided into three main groups of buttons, each consisting of three buttons. When you run a program in debugging mode, the toolbar looks like the following:
- The first three buttons allow you to step through your program code.
- The next three buttons determine how VLISP should proceed whenever it has stopped at a breakpoint or an error.
- The next three buttons set or remove a breakpoint, add a Watch, and jump to the position within your source code where the last break occurred.
The last button on the Debug toolbar is a Step Indicator. It does not execute any function but provides a visual indication of where your cursor is positioned as you step through your code. When you are not running in debugging mode, this button appears blank.
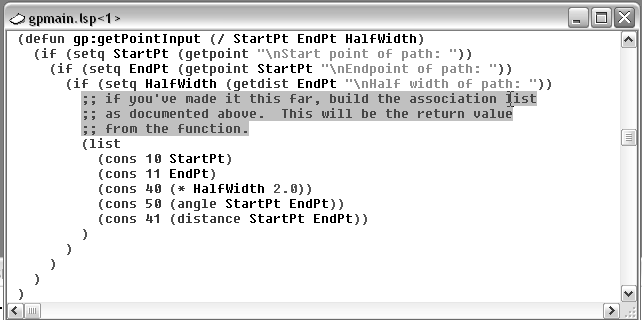
- In
the VLISP editor window containing gpmain.lsp, position your cursor just
in front of the opening parenthesis of the setq function
of the following line of code, within the gp:getPointInput function:
(setq HalfWidth (getdist EndPt "\nhalf-width of path: "))
- Click the mouse once.
The position is illustrated in the following screen snapshot:
- With the text insertion point
set, choose the Toggle Breakpoint button on the Debug toolbar.

The Toggle Breakpoint button acts as a toggle, alternating between on and off states. If there is no breakpoint at the cursor position, it sets one; if there is already a breakpoint there, it removes it.
- Choose the Load Active
Edit Window button on the Tools toolbar to load the file.

- Run the (C:GPath) function
from the VLISP Console prompt.
VLISP executes the program normally up to the breakpoint. In this case, it will prompt you for the first two points—the start point and endpoint of the path.
- Specify the start point
and endpoint when prompted.
After you specify the points, VLISP suspends execution of the program and returns focus to the text editor window, highlighting the line of code at the breakpoint position:
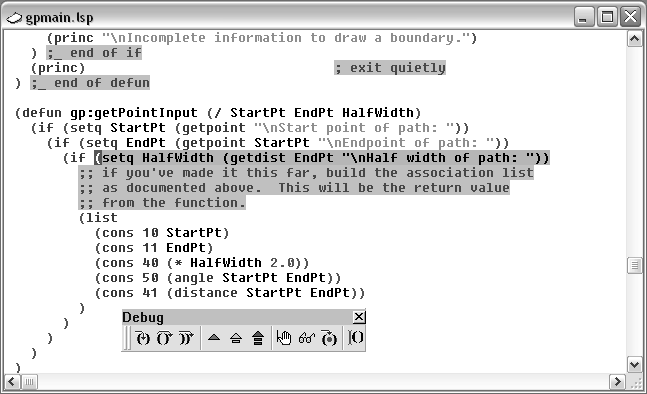
There are a couple of things to notice:
