3. Rebuilding Missing Data
You can use the LabVIEW System Identification Assistant to rebuild bad or missing stimulus and response data sets by defining the expected range of the measurement.
In the Loading Files exercise, you loaded two signals from a measurement data file. Spikes in the signals indicate missing data. When sensor failures occur, the measuring instrument records the voltage or motor speed as the default maximum value of the instrument. These default values are out of the range of the measuring instrument and indicate that the measurement for that particular sample time is missing.
Complete the following steps to rebuild the missing data points in the signals.
- Right-click the empty white area of the Project View and select System Identification»Preprocessing»Rebuild Missing Data from the shortcut menu to add a Rebuild Missing Data step.
Notice that the Step Setup tab changes from displaying the Configuration View of the Load from LVM step to displaying the Configuration View of the Rebuild Missing Data step. - On the Input Signals tab in the Configuration View, verify that Raw Stimulus Data is selected in the Stimulus Signal pull-down menu. This pull-down menu specifies the stimulus signal you want to rebuild.
- Verify that Raw Response Data is selected in the Response Signal pull-down menu. This pull-down menu specifies the response signal you want to rebuild.
- On the Configuration tab in the Configuration View, place checkmarks in the Specify upper limit and Specify lower limit checkboxes.
- Set Specify upper limit to 80. The Rebuild Missing Data step rebuilds all data with values above the upper limit.
- Set Specify lower limit to -80. The Rebuild Missing Data step rebuilds all data with values below the lower limit.
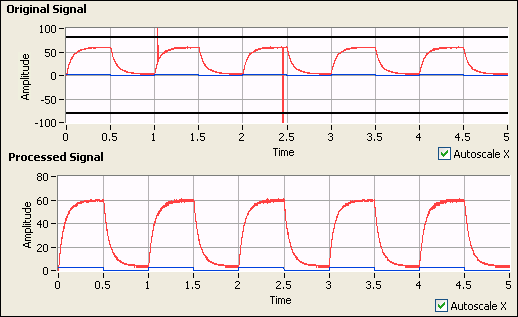
Notice that horizontal lines representing the upper and lower limits appear on the Original Signal graph. You can drag these lines up and down to set the upper and lower limits visually. - Compare the Original Signal graph with the Processed Signal graph. The Original Signal graph displays the input signals for this step. The Processed Signal graph displays the rebuilt signals. Preprocessed Input 1 in the Project View is the rebuilt signal corresponding to Raw Stimulus Data in the Configuration View. Preprocessed Input in the Project View is the rebuilt signal corresponding to Raw Response Data in the Configuration View.
In the Processed Signal graph, notice that the rebuilt signal corresponding to Raw Response Data does not contain the spikes near sample times 1.0 and 2.5, as shown in the following figure.

- In the Project View, rename the Preprocessed Input 1 signal to Rebuilt Stimulus.

Tip When you move the cursor over a renamed input or output signal in the Project View, a dialog bubble appears with both the new name and the original name of the signal. You also can use this bubble to view the entire name of the signal if the width of the Project View is too small to view the full name. - Rename the Preprocessed Input signal to Rebuilt Response.
- Select File»Save Project to save the project.
| Previous: 2. Loading Files | Next: 4. Splitting Data |