CHART Output Format
The CHART output format creates image files containing charts of the output record field values.
When using the CHART output format, output record fields must be of the
INTEGER or REAL data types,
in order for their values to be plotted in a chart.
The first field only can optionally be of the
STRING or TIMESTAMP data types,
in which case its values are used as the names of the categories on the X-axis of the
chart.
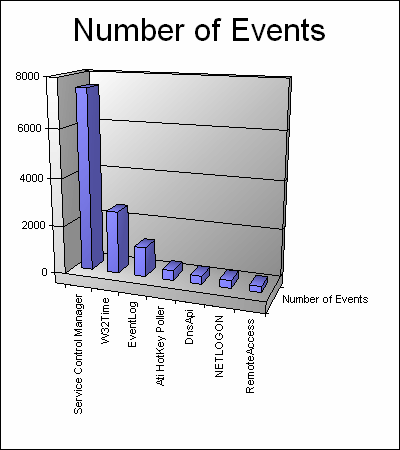
The following example command creates a chart plotting the number of events logged in the System Event Log by each event source. The first field in the output records of this query is the name of the event source, and the CHART output format will use its values to label the categories along the X-axis of the chart. The second field in the output records is the number of events, which will be plotted on the chart:
LogParser "SELECT SourceName, COUNT(*) AS [Number of Events] INTO Events.gif FROM System GROUP BY SourceName ORDER BY [Number of Events] DESC" -o:CHART -chartType:Column3DThe resulting chart will look like the following example:

Charts can also contain multiple series plotted from the values of different output record
fields.
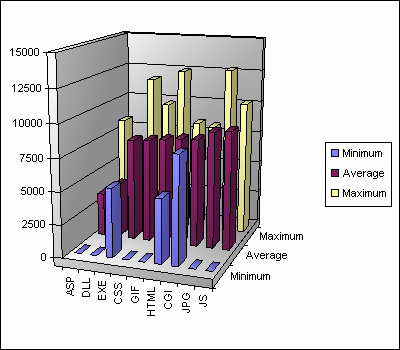
For example, the following command calculates the average, minimum, and maximum number of
bytes served for each web page type:
LogParser "SELECT TO_UPPERCASE(EXTRACT_EXTENSION(cs-uri-stem)) AS PageType, MIN(sc-bytes) AS Minimum, AVG(sc-bytes) AS Average, MAX(sc-bytes) AS Maximum INTO BytesChart.gif FROM <1> GROUP BY PageType ORDER BY Average ASC" -o:CHART -chartType:Column3DThe resulting chart will look like the following example:

The CHART output format requires the Microsoft Office Web Components, which are
generally installed with Microsoft Office 2000, Microsoft Office XP, and Microsoft Office
2003.
In order to use the CHART output format, users must have a valid license of Microsoft
Office for the computer executing the Log Parser query.
Configuration Scripts
Into-Entity Syntax
Parameters
Examples