Designing a Floating-Point Filter Part 1: Entering Filter Specifications (Digital Filter Design Toolkit)
In Part 1 of this tutorial, you create and specify a floating-point filter design by using the Classical Filter Design Express VI.
Complete the following steps to design a lowpass infinite impulse response (IIR) filter by using this Express VI.
- Launch LabVIEW.
- In the Getting Started window, click the Blank VI link in the New section to create a new, blank VI.
- Display the block diagram by selecting Window»Show Block Diagram.

Tip You can press the <Ctrl-E> keys to switch between the block diagram window and the front panel window of the VI. - If you do not see the Functions palette, select View»Functions Palette to display this palette.
- On this palette, select Signal Processing»Digital Filter Design»Filter Design to display the Filter Design VIs.
- Click the Classical Filter Design Express VI and place it on the block diagram.
 Place
Place
 Find
Find
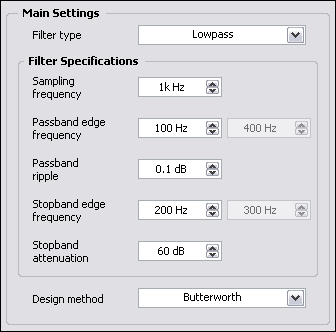
The Configure Classical Filter Design dialog box appears. - Select Butterworth from the Design method pull-down menu.
Ensure the filter specifications match the following figure.

Note The configuration in this example specifies a lowpass Butterworth filter. This filter passes frequencies below 100 Hz with a maximum ripple of 0.1 dB and attenuates frequencies above 200 Hz with a minimum attenuation of 60 dB. This filter is suitable for filtering electrocardiograph (ECG) signals. - Click the OK button to apply the current configuration and close the dialog box.
- Select File»Save As and save this VI as Designing a Floating-Point Filter.vi in an easily accessible location.
You can experiment with the Classical Filter Design Express VI by choosing other Design method options and modifying one or more of the parameters of the filter design. You can enter the exact values for filter parameters by using the controls on the left side of the configuration dialog box or you can use the interactive graphical interface on the upper right side of the dialog box.
To use the graphical interface, click the Magnitude graph and drag the passband and stopband lines to modify the location of the passband and stopband frequencies. The corresponding numeric controls and graphs update to show the revised filter design.
 |
Note This tutorial shows one Express VI and one design method. The LabVIEW Digital Filter Design Toolkit includes many other filter design VIs and design methods you can use. |
After you enter the filter specifications for a digital filter, you can analyze the characteristics of the filter in Part 2 of this tutorial.
 |
Note Refer to labview\examples\Digital Filter Design\Getting Started\Tutorials\Designing a Floating-Point Filter\Designing a Floating-Point Filter Part 1.vi for a completed version of the digital filter from this part of the tutorial. |
| Previous: Designing a Floating-Point Filter | Next: Analyzing a Digital Filter Design |