Line charts (version 2)

Offline MediaWiki Code Editor

Line Charts (version 2)
Previous Top Next

Line Charts-2

graphic


{{Line chart | color_background = white | width = 500 | height = 350 | padding_left = 40 | padding_right = 15 | padding_top = 10 | padding_bottom = 20 | number_of_series = 3 | number_of_x-values = 10 | label_x1 = Val. 1 | label_x2 = Val. 2 | label_x3 = Val. 3 | label_x4 = Val. 4 | label_x5 = Val. 5 | label_x6 = Val. 6 | label_x7 = Val. 7 | label_x8 = Val. 8 | label_x9 = Val. 9 | label_x10 = Val. 10 | y_max = 3000 | y_min = 1000 | scale = yes | interval_primary_scale = 1000 | interval_secondary_scale = 100
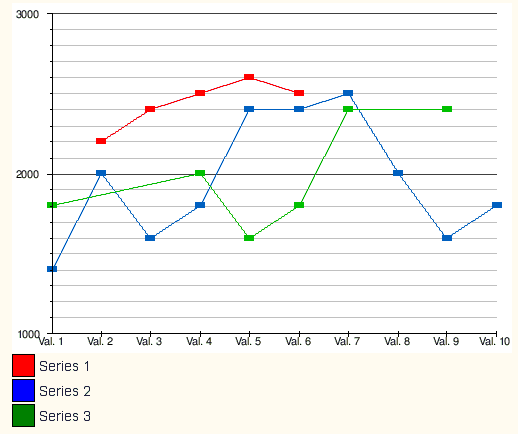
| S01V02 = 2200 | S01V03 = 2400 | S01V04 = 2500 | S01V05 = 2600 | S01V06 = 2500
| S02V01 = 1400 | S02V02 = 2000 | S02V03 = 1600 | S02V04 = 1800 | S02V05 = 2400
| S02V06 = 2400 | S02V07 = 2500 | S02V08 = 2000 | S02V09 = 1600 | S02V10 = 1800
| S03V01 = 1800 | S03V04 = 2000 | S03V05 = 1600 | S03V06 = 1800 | S03V07 = 2400
| S03V09 = 2400 | points = yes }} {{legend|red|Series 1}} {{legend|blue|Series 2}}
{{legend|green|series 3}}