|
Line Charts
|
Previous Top Next |
|
12,6,14,2,10,7,9}}
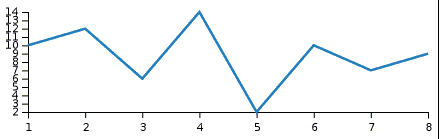
=Legend|type=line|x=1,2,3,4,5,6,7,8|y1=10,12,6,14,2,10,7,9|y2=2,4,6,8,13,
11,9,2|colors=#0000aa,#ff8000}}
|
|
Line Charts
|
Previous Top Next |
|
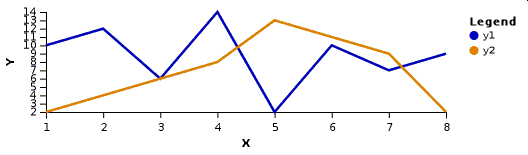
12,6,14,2,10,7,9}}
=Legend|type=line|x=1,2,3,4,5,6,7,8|y1=10,12,6,14,2,10,7,9|y2=2,4,6,8,13,
11,9,2|colors=#0000aa,#ff8000}}
|