RSQ
From MS Excel Spreadsheet
Returns the square of the Pearson product moment correlation coefficient through data points in known_y's and known_x's. For more information, see PEARSON. The r-squared value can be interpreted as the proportion of the variance in y attributable to the variance in x.
Syntax
RSQ(known_y's,known_x's)
Known_y's is an array or range of data points.
Known_x's is an array or range of data points.
Remarks
- The arguments must be either numbers or names, arrays, or references that contain numbers.
- If an array or reference argument contains text, logical values, or empty cells, those values are ignored; however, cells with the value zero are included.
- If known_y's and known_x's are empty or have a different number of data points, RSQ returns the #N/A error value.
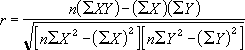
- The equation for the r value of the regression line is:
Example
The example may be easier to understand if you copy it to a blank spreadsheet.
- Create a blank spreadsheet.
- Select the example in the Help topic.

Selecting an example from Help
- Press CTRL+C.
- In the spreadsheet, select cell A1, and press CTRL+V.
- To switch between viewing the formula that returns the result and the result in the cell, select the cell and press F2 and then ENTER, or click Commands and Options on the spreadsheet toolbar, click the Formula tab, and look in the Formula in active cell (active cell) box.
| Known y | Known x |
|---|---|
| 2 | 6 |
| 3 | 5 |
| 9 | 11 |
| 1 | 7 |
| 8 | 5 |
| 7 | 4 |
| 5 | 4 |
| Formula | Description (Result) |
| =RSQ(A2:A8,B2:B8) | Square of the Pearson product moment correlation coefficient through data points above (0.05795) |