LOGEST
From MS Excel Spreadsheet
In regression analysis, calculates an exponential curve that fits your data and returns an array of values that describes the curve. Because this function returns an array of values, it must be entered as an array formula.
The equation for the curve is:
y = b*m^x or y = (b*(m1^x1)*(m2^x2)*_) (if there are multiple x-values)
where the dependent y-value is a function of the independent x-values. The m-values are bases corresponding to each exponent x-value, and b is a constant value. Note that y, x, and m can be vectors. The array that LOGEST returns is {mn,mn-1,...,m1,b}.
Syntax
LOGEST(known_y's,known_x's,const,stats)
Known_y's is the set of y-values you already know in the relationship y = b*m^x.
-
If the array known_y's is in a single column, then each column of known_x's is interpreted as a separate variable.
-
If the array known_y's is in a single row, then each row of known_x's is interpreted as a separate variable.
Known_x's is an optional set of x-values that you may already know in the relationship y = b*m^x.
-
The array known_x's can include one or more sets of variables. If only one variable is used, known_y's and known_x's can be ranges of any shape, as long as they have equal dimensions. If more than one variable is used, known_y's must be a range of cells with a height of one row or a width of one column (which is also known as a vector).
-
If known_x's is omitted, it is assumed to be the array {1,2,3,...} that is the same size as known_y's.
Const is a logical value specifying whether to force the constant b to equal 1.
-
If const is TRUE or omitted, b is calculated normally.
-
If const is FALSE, b is set equal to 1, and the m-values are fitted to y = m^x.
Stats is a logical value specifying whether to return additional regression statistics.
-
If stats is TRUE, LOGEST returns the additional regression statistics, so the returned array is {mn,mn-1,...,m1,b;sen,sen-1,...,se1,seb;r 2,sey; F,df;ssreg,ssresid}.
-
If stats is FALSE or omitted, LOGEST returns only the m-coefficients and the constant b.
For more information about additional regression statistics, see LINEST.
Remarks
- The more a plot of your data resembles an exponential curve, the better the calculated line will fit your data. Like LINEST, LOGEST returns an array of values that describes a relationship among the values, but LINEST fits a straight line to your data; LOGEST fits an exponential curve. For more information, see LINEST.
- When you have only one independent x-variable, you can obtain the slope (m) and y-intercept (b) values directly by using the following formulas:
Slope (m):
INDEX(LOGEST(known_y's,known_x's),1)Y-intercept (b):
INDEX(LOGEST(known_y's,known_x's),2)You can use the y = b*m^x equation to predict future values of y, but the GROWTH function will do this for you. For more information, see GROWTH.
- Formulas that return arrays must be entered as array formulas.
- When entering an array constant such as known_x's as an argument, use commas to separate values in the same row and semicolons to separate rows. Separator characters may be different depending on your locale setting in Regional Settings or Regional Options in Control Panel.
- You should note that the y-values predicted by the regression equation may not be valid if they are outside the range of y-values you used to determine the equation.
Example 1: m-coefficients and the constant b
The example may be easier to understand if you copy it to a blank spreadsheet.
- Create a blank spreadsheet.
- Select the example in the Help topic.

Selecting an example from Help
- Press CTRL+C.
- In the spreadsheet, select cell A1, and press CTRL+V.
- To switch between viewing the formula that returns the result and the result in the cell, select the cell and press F2 and then ENTER, or click Commands and Options on the spreadsheet toolbar, click the Formula tab, and look in the Formula in active cell (active cell) box.
| Month | Units |
|---|---|
| 11 | 33,100 |
| 12 | 47,300 |
| 13 | 69,000 |
| 14 | 102,000 |
| 15 | 150,000 |
| 16 | 220,000 |
| Formula | Formula |
| =LOGEST(B2:B7,A2:A7, TRUE, FALSE) |
Note The formula in the example must be entered as an array formula. After copying the example to a blank spreadsheet, select the range A9:B10 starting with the formula cell. Press F2, and then press CTRL+SHIFT+ENTER. If the formula is not entered as an array formula, the single result is 1.463275628.
When entered as an array, the m-coefficients and the constant b are returned.
y = b*m1^x1
or using the values from the array:
y = 495.3 * 1.4633x
You can estimate sales for future months by substituting the month number for x in this equation, or you can use the GROWTH function.
Example 2: Full statistics
The example may be easier to understand if you copy it to a blank spreadsheet.
- Create a blank spreadsheet.
- Select the example in the Help topic.
Selecting an example from Help
- Press CTRL+C.
- In the spreadsheet, select cell A1, and press CTRL+V.
- To switch between viewing the formula that returns the result and the result in the cell, select the cell and press F2 and then ENTER, or click Commands and Options on the spreadsheet toolbar, click the Formula tab, and look in the Formula in active cell (active cell) box.
| Month | Units |
|---|---|
| 11 | 33,100 |
| 12 | 47,300 |
| 13 | 69,000 |
| 14 | 102,000 |
| 15 | 150,000 |
| 16 | 220,000 |
| Formula | |
| =LOGEST(B2:B7,A2:A7, TRUE, TRUE) |
Note The formula in the example must be entered as an array formula. After copying the example to a blank spreadsheet, select the range A9:B13 starting with the formula cell. Press F2, and then press CTRL+SHIFT+ENTER. If the formula is not entered as an array formula, the single result is 1.463275628.
When entered as an array, the following regression statistics are returned. Use this key to identify the statistic you want.
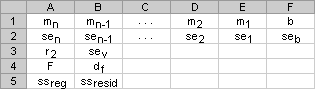
You can use the additional regression statistics (cells A10:B13 in the above output array) to determine how useful the equation is for predicting future values.
Important The methods you use to test an equation using LOGEST are similar to the methods for LINEST. However, the additional statistics LOGEST returns are based on the following linear model:
ln y = x1 ln m1 + ... + xn ln mn + ln b
You should keep this in mind when you evaluate the additional statistics, especially the sei and seb values, which should be compared to ln mi and ln b, not to mi and b. For more information, consult an advanced statistics manual.