

To integrate FxCopCmd into Visual Studio, you must configure Visual Studio to run FxCopCmd as an external tool. After it is configured, FxCopCmd uses the /console and /consoleXsl options to send an abbreviated analysis report, including source code information if available, to the Output window in Visual Studio.
To set up FxCop as an external tool in Visual Studio
On the Tools menu, click External Tools, and then click Add.
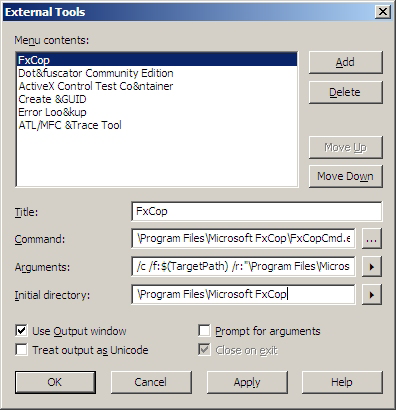
The External Tools configuration dialog box is displayed. The following screen shot shows the dialog box after the steps in this procedure have been completed.

FxCop appears on the Tools menu.
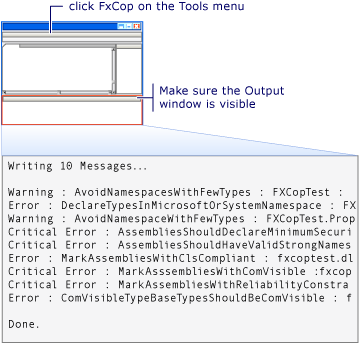
After you successfully build your project, you can perform an FxCop analysis without leaving the integrated development environment (IDE). To do this, click FxCop on the Tools menu. Make sure the Output window is visible; this is where the analysis output is displayed. The following screen shot shows the IDE with the output of an FxCopCmd analysis displayed in the Output window.

If source code information is available for the programming element that caused a message to be generated, the list item for that element in the analysis report starts with the source code file and line number information for the element. Clicking the item will move the cursor to the corresponding line in the Code Editor. For more information, see Analysis Reports.
