Performing an Analysis
From FxCop
To analyze assemblies, FxCop requires the following information:
One or more target assemblies to be analyzed.
One or more rules. FxCop enables a default set of rules in new projects.
To start, specify the managed code assembly to analyze. The assembly must be either an executable file or a DLL.
To specify an assembly and run an FxCop analysis
On the Start menu, click FxCop.
— or —
In the installation directory, double-click FxCop.exe.
On the Project menu, click Add Targets.
Locate the assembly you want to add, and then click Open.
 Note
NoteThe assembly is either an .exe or a .dll file.
Start the analysis by using one of the following methods:
Click the Analyze button on the toolbar.
On the Project menu, select Analyze.
Press the F5 key.
When analysis starts, the Analyzing with engine dialog box appears. This shows a progress meter and a Cancel button. The label of the dialog box includes the name of the analysis engine that is being used. When analysis is finished, the analysis report is displayed in the messages pane. If there are no messages, this pane is empty.
 Canceling an Analysis
Analysis can be canceled at any time, but analysis results might be compromised.
To cancel an analysis
In the Analyzing with engine dialog box, click Cancel.
The Analysis Summary dialog box appears. It displays analysis statistics and error messages.
A message is always in one of the following states: active, excluded, or absent. For more information, see "Message States" in the Managing Messages topic. When an analysis starts, all messages in the Active state are changed to the Absent state; individual messages are then changed back to Active as they are re-encountered. Any messages that are not re-encountered before analysis is canceled remain in the Absent state. This state compromises the analysis results. Excluded messages are unaffected.
Viewing a Summary of Analysis Results
During an analysis, FxCop gathers statistics and catches exceptions thrown by rules. Rule exceptions do not prevent an analysis from continuing, unless the total number of exceptions exceeds the limit specified for the project; however, the message report is usually incomplete. For information about how to set the exception limit, see "Setting Project Options" in the
If an analysis generates any errors, the Analysis Summary dialog box is displayed after the analysis is completed. At any other time, select the Analysis Summary command on the Project menu to manually view a summary of the most recent analysis. The following screen shot shows a sample analysis report as it appears in the Analysis Summary dialog box.
Analysis Summary dialog box
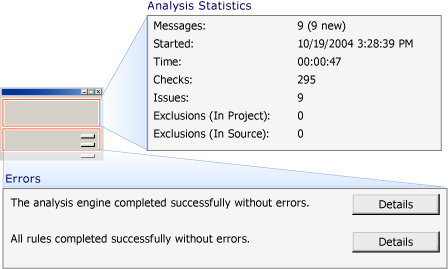
The report displays the number of messages generated, the analysis start time, and the duration of the analysis. The summary report also indicates any problems FxCop encountered while performing the analysis.
Rule Errors
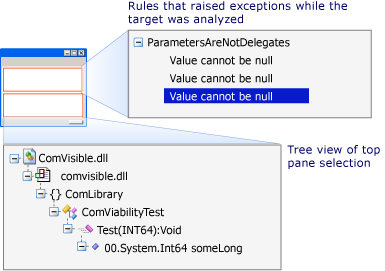
To display the Rule Error(s) dialog box, click Details at the bottom of the Analysis Summary dialog box.
The following illustration shows the Rule Error(s) dialog box. The top pane displays the rules that raised exceptions while the target was analyzed. Expand a rule to display the list of errors generated by that rule. If you select an error, the bottom pane shows a tree view of the target that the rule was analyzing when it generated the error. If you double-click the target, the corresponding target is highlighted in the Targets tree of the Configuration pane.
Rule Error(s) dialog box
Analysis Errors
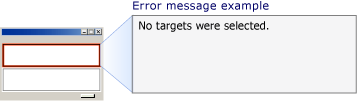
To display the Analysis Error(s) dialog box, click Details at the top of the Analysis Summary dialog box.
The Analysis Error(s) dialog box is shown in the following illustration.
Analysis Error(s) dialog box
The most common analysis problems are as follows:
-
The current project has no targets selected.
-
The current project has no rules selected.
-
An assembly referenced by a target could not be located for analysis.
The vast majority of analysis errors are caused by a missing assembly. During analysis, the types referenced by an assembly must be available to FxCop. When FxCop cannot locate a type, an exception is reported for the assembly that contains the type; its message is "File or assembly name SomeAssembly, or one of its dependencies, was not found." To fix this problem, add the missing assembly to the directory that contains the assembly being analyzed, or add it to the global assembly cache. For information about the global assembly cache, see the .NET Framework SDK documentation, or visit the Microsoft Developers Network Library on the Internet.
If all managed assemblies are apparently accounted for and this error remains, a missing native dependency might be the cause. This is most common for managed code extensions for C++ assemblies.
For other errors, such as those accompanied by the message "Type SomeType could not be loaded.", use the Assembly Binding Log Viewer (Fuslogvw.exe) that is included with the .NET Framework SDK to determine the cause of the problem. This tool provides detailed information about assembly loading failures.