Debugging AutoHotkey scripts
From AutoHotkey SciTE
Debugging AutoHotkey scripts
You can debug your scripts. In order to do so, either press F7, go to Tools > Debug or click on the toolbar button. The SciTE debugger will start up and you'll enter Debugging mode.
Basic debugging controls
In Debugging mode you can control the execution of your script. When the script is paused, the next line that will be executed is highlighted. These are the available commands (all can be found in the toolbar):
- Run (F5). Execution is paused when a breakpoint is reached (see below).
- Pause script.
- Stop script.
- Run current line of code (F10).
- Run until next line of code (F11).
- Callstack (see below).
- Variable list (see below).
Breakpoints
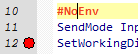
Breakpoints are pausing points in a program. If AutoHotkey is about to execute a line that has a breakpoint, execution is paused. In order to set a breakpoint on a line, click on the margin to the right of the line numbers:
Inspecting variable contents
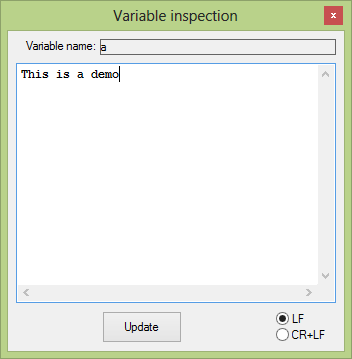
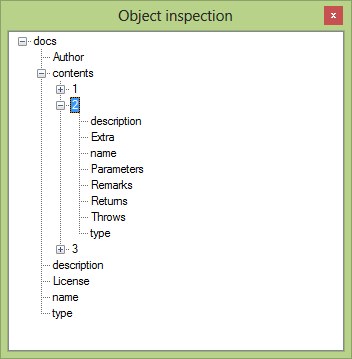
You can retrieve the contents of a variable and even modify them. In order to do so, find an instance of the variable name, right click it (or select it and right click) then choose "Inspect variable..." to reveal the Variable inspection dialog. If the variable contains an object, you'll be presented with the Object inspection dialog instead. In it, you can double-click a field to inspect and edit it.
Listing all variables
You can also list all variables by clicking on the appropriate toolbar button.
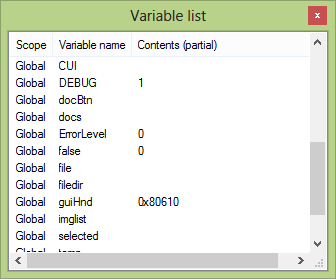
In order to inspect a variable, double click on it.
Viewing the callstack
Sometimes it is useful to know the path the script has taken. This list is called the callstack. In order to see it, click on the appropriate toolbar button.
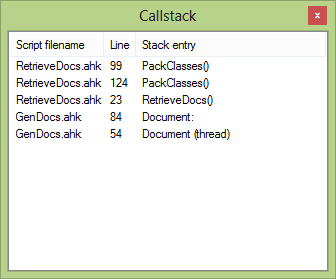
You can go to each of the script positions by double-clicking them in the callstack viewer.
Debugging currently running scripts
It is possible to debug a script that is already running. In order to do so go to Tools > "Debug a currently running script...", then a window should appear with a list of all scripts available for debugging. Double-click the one you want to debug.