Backup Performance
The Performance tab displays performance information for current and recent backups.
A list of backup sets displays at the top of the window and includes the following information:
| Type |
Backup set type:
|
| Backup Set | Backup set ID if known. |
| Open Time | Date and time of start of backup. |
| Close Time | Date and time of end of backup if known. |
| Elapsed Time | Elapsed time of backup if known. |
| Input Files | Number of input. |
| Input Bytes | Total size of input files. |
| Input Rate | Average aggregate input rate in bytes per second. |
| Input Ready | Percentage of reads when data was immediately available. |
| Input Short Waits | Percentage of reads when data was not immediately available, but data became available after a non-blocking pool for I/O. |
| Input Long Waits | Percentage of reads in which data did not become available until after a blocking I/O operation. |
| Input Sync IO | Total read time spent on synchronous I/O (if using synchronous as opposed to asynchronous I/O). |
| Output Files | Number of output files. |
| Output Bytes | Total size of output files. |
| Output Rate | Average aggregate output rate in bytes per second. |
| Output Ready | Percentage of writes when data could be immediately written. |
| Output Short Waits | Percentage of writes when data could not be immediately written, but was written after a non-blocking I/O operation. |
| Output Long Waits | Percentage of writes that resulted in a blocking I/O operation. |
| Output Sync IO | Total write time spent on synchronous I/O (if using synchronous as opposed to asynchronous I/O) |
| Empty Block Compression | Percentage of data files that did not need to be read because they did not contain active data. |
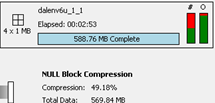
| Null Block Compression | Percentage of blocks read but not written because the blocks were null. |
| SID | Session ID of RMAN backup session |
| Serial | Serial number of RMAN backup session |
| Usage | Usage number of RMAN backup session |
Note: This information primarily comes from the V$BACKUP_ASYNC_IO and V$BACKUP_SYNC_IO views. The views are volatile and clear when the data source shutdowns. This list usually includes data for all backups.
Performance details display in the lower pane and includes the following information:
| Summary | Displays a high-level analysis of the performance data. The top portion of the pane displays some summary information. The lower half displays performance-related observations from the expert-system healthcheck. |
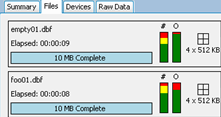
| Files |
Displays a file-level visualization of the backup. The left side represents the input files:
Notes:
The right side represents the output files:
Notes:
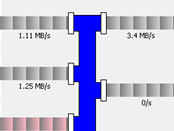
The center section represents the flow of data through the Oracle shadow process that writes the backup:
|
| Devices |
Displays data at a device level. Notes:
|
| Raw Data |
Displays data gathered from the V$BACKUP_AYSNC_IO and V$BACKUP_SYNC_IO tables. Notes:
|


