Timing and Transition Express VI

LabView Acquire Signals Express VIs

Timing and Transition Express VI

Owning Palette: Time-Domain Measurements Express VIs

Installed With: LabVIEW SignalExpress

Measures timing and transition parameters on single pulses and on rising and falling edges.

If the signal includes a single positive or negative pulse or a pulse train, you can measure the pulse frequency, period (1/frequency), duration, and duty cycle. You also can use this step to measure the transition time, rise or fall time, the amount of undershoot and overshoot, and the slew rate on rising and falling edges. You can select the pulse polarity and the pulse and/or edge numbers on the Advanced page.

Details  

Dialog Box Options
 Place on the block diagram  Find on the Functions palette

Dialog Box Options

ParameterDescription
Input SignalDisplays the input signal to measure. Cross-hair cursors indicate the pulse and edges to use for the measurements. This step marks edges at the pulse and mid-transition points at its center position using the color code in the three result tables.
  • Displayed signal—Specifies the signal(s) to display in the preview graph(s). This option appears only when you select a group of signals for the input.
    Note  If the input signals include scalar values that depend on the values of input waveform signals, you cannot specify to display all signals in the preview graph(s).
Autoscale amplitudeScales the Amplitude (V) axis of the Acquired Data graph. The default is to autoscale the amplitude.
InputContains the following option:
  • Input signal—Specifies the analog waveform for the step.
Configuration and ResultsContains the following options:
  • Pulse results—Contains the results of the pulse measurements. If one or more measurements you select fail, this step highlights the background color of the failing measurements in red. To disable failing measurements, remove the checkmark from the corresponding checkboxes. Contains the following options:
    • Export frequency—Measures the frequency of a pulse train and exports the measurement result to the Project View.
    • Export period—Measures the period of a pulse train and exports the measurement result to the Project View.
    • Export duration—Measures the duration of a pulse and exports the measurement result to the Project View.
    • Export duty cycle—Measures the duty cycle of a pulse and exports the measurement result to the Project View.
  • Rising edge results—Contains the results of the rising edge transition measurements. If one or more measurements you select fail, this step highlights the background color of the failing measurements in red. To disable failing measurements, remove the checkmark from the corresponding checkboxes. Contains the following options:
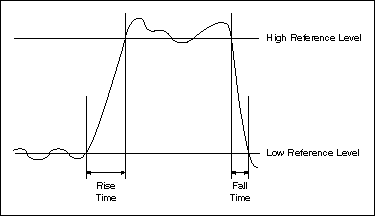
    • Export rise time—Measures the rising transition time (rise time) of an edge and exports the measurement result to the Project View. The rise time is the time it takes the signal to change from a low reference level (10% of the amplitude of the signal) to a high reference level (90% of the amplitude of the signal).
    • Export rising undershoot—Measures the percentage amount of undershoot that precedes a rising edge and exports the measurement result to the Project View.
    • Export rising overshoot—Measures the percentage amount of overshoot that follows a rising edge and exports the measurement result to the Project View.
    • Export rising slew rate—Measures the slew rate, or the ratio between (90% amplitude – 10% amplitude) and the rise time, of a rising edge and exports the measurement result to the Project View.
  • Falling edge results—Contains the results of the falling edge transition measurements. If one or more measurements you select fail, this step highlights the background color of the failing measurements in red. To disable failing measurements, remove the checkmark from the corresponding checkboxes. Contains the following options:
    • Export fall time—Measures the falling transition time (fall time) of an edge and exports the measurement result to the Project View. The fall time is the time it takes the signal to change from a high reference level (90% of the amplitude of the signal) to a low reference level (10% of the amplitude of the signal).
    • Export falling undershoot—Measures the percentage amount of undershoot that follows a falling edge and exports the measurement result to the Project View.
    • Export falling overshoot—Measures the percentage amount of overshoot that precedes a falling edge and exports the measurement result to the Project View.
    • Export falling slew rate—Measures the slew rate, or the ratio between (90% amplitude – 10% amplitude) and the fall time, of a falling edge and exports the measurement result to the Project View.
AdvancedContains the following options:
  • Pulse Definition—Contains the following options:
    • Pulse polarity—Specifies if the pulse to measure is positive (High Pulse) polarity or negative (Low Pulse) polarity.
    • Pulse number—Specifies which pulse number in a pulse train to use for the measurement.
  • Transition Definition—Contains the following options:
    • Rising edge number—Specifies which rising edge to use for the measurement.
    • Falling edge number—Specifies which falling edge to use for the measurement.

Timing and Transition Details

The following image shows a sample pulse. Timing and Transition uses a high reference level of 90% of the amplitude of the signal and a low reference level of 10% of the amplitude of the signal. In a timing and transition measurement, overshoot is the height of a local maximum preceding a rising or falling edge, depending on the Pulse polarity you specify. Undershoot is the height of the local minimum preceding a rising or falling edge, depending on the Pulse polarity you specify.