Project
From LT10 EVEL
Project
Project in LT10 is collection of documents. LT10 allows to work with multiple projects as if they were documents in MDI application. Moreover projects may run their calculations simultaneously without necessarity of running another instances of whole LT10 application.
- note
- User has to be cautious in running big number of calculations since each project runs its calculations in new thread. Multiple threads on single-CPU computers may affect on speed of the calculations.
Every project window in LT10 program acts like document in MDI Application and is simply collection of tab pages. Beside of tab pages which contain tracking and modifing controls there are additional tab pages responsible for managing parameters of each document in project.
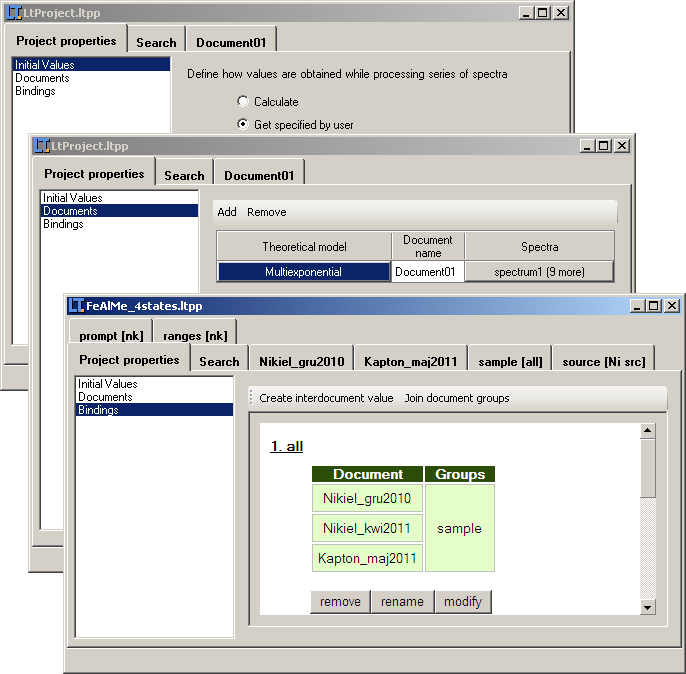
Project properties tab
Set of properties specific for particular project.
- Initial values
- Defines how initial parameter values for spectra in series are obtained: either by automatically copying values from previous spectrum in series or using those, determined in previous calculations.
- Documents
- Documents present in project. Both spectra series and theoretical model of each document may be modified.
- Bindings
- Overview of all bindings defined in project. Both interdocument parameters and shared groups are displayed.
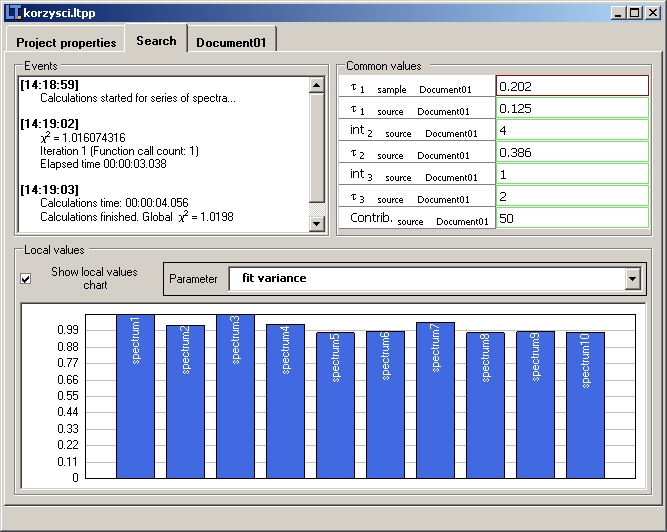
Search tab
Search tab presents actual state of running calculations. The tab is divided into three parts
- Events
- Text area which displays information about such events in calculation process as changes in fit variance, time when calculations finished and so on.
- Common values
- List of all parameters with common values in each document and each group (Common Free and Common Fixed statuses, see also: parameter status)
- Local values
- This group box contains chart which presents relationships between chosen parameters and spectrum index in series currently fitted. If there are any parameters with local values (Local Free and Local Fixed statuses) those parameters are available to choose in Parameter combo box.
- note
- Although chart is good view of changes made by calculations process, user is allowed to switch this option off which may slightly increase calculations speed.
Document tab
This tab page contains another tab pages control which holds as many parameter grids as many parameter groups exist in chosen theoretical model. Moreover, parameter names, their amount and properties depends on model binded to this document. Screenshot of such document is presented below (binded theoretical model is multiexponential model used to positron anihilation spectroscopy analysis).
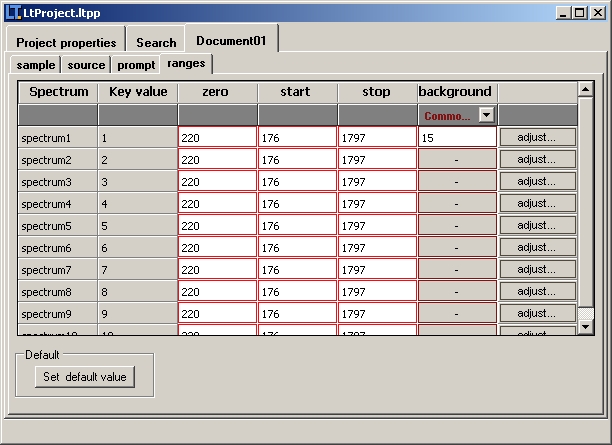
As shown in picture document tab caption is equal to the one provided while creating owning project.
The layout of each page in document is similar. The top part of page is occupied by grid containing parameters for each spectrum. Since some of the parameters may have statuses (a combinations of range specificatos: common, local with freedom degree specificators: fixed, free; for more about statuses see also: parameter status) one of the top rows in grid holds controls which allows to change those statuses for chosen parameters. Each spectrum in document has corresponding row with parameters which belongs to the just-displaying group tab page.
- note
- Whereas most of the parameter values are editable in parameters grid - some of them aren't. For example in groups where component count is variable - value of first intensity (if such parameter exist in the group) is not editable and is changing while providing values of intensities for other components. Value of this intensity adapts to other intensities to make sum of all in group equal to 100%.
Below grid, there are often additional group-specific tools. For example there may be component count setter, default values provider or other handy tools.