Getting started with LT10
From LT10 EVEL
Getting started with LT10
Once you've downloaded and installed LT10 you have are able to run program. Below you can see the main window which
appears after program execution.
This window is the desktop of the LT10 program which holds opened projects. You are allowed to open multiple projects as if they were a documents in MDI application. To switch between them use either Windows menu or keyboard shortcut Ctrl+Tab.
In order to work with spectra series you have to either open existing project or create the new one. This section presents wizard which creates new project.
To create a new project choose File -> New. All you have to do is to choose theoretical model and spectra of interest. It is done by clicking proper button in documents tree in New Project dialog (see figure below).
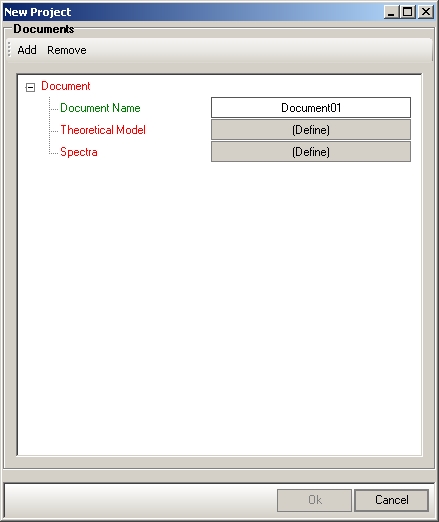
Although, project will contain one document by default, with chosen theoretical model and spectra, document count may be changed with Add/Remove buttons in New Project dialog. When working with multiple documents with different theoretical models and spectra it is adviced to name each document by clicking default document name.
- note
- Both theoretical model and spectra of each document, although chosen while creating new project, may be modified after project is created in project's Propeties. New documents may be added as well.
Once project is created, theoretical function paramter must be set to its initial value, as close to the
real one as possible. The more exact values is provided the more reliable analysis result can be expected.
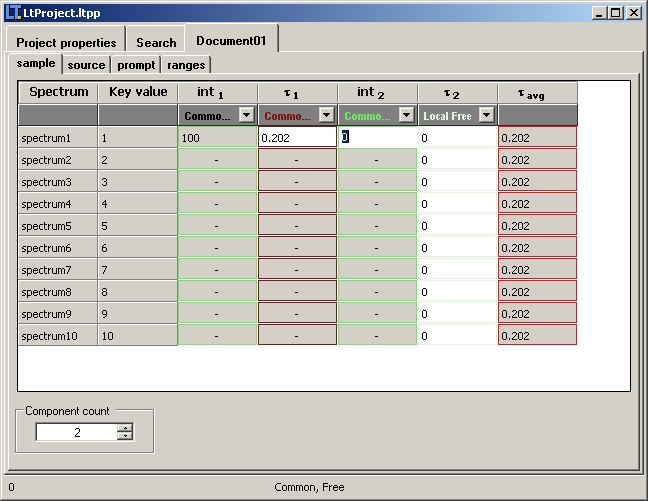
Parameters are logically grouped in four groups:
- sample parameters (dependent on theoretical model)
- source parameters (intensities and lifetimes of number of components)
- prompt parameters (resolution curve parameters)
- range parameters (analysis range, zero channel and background)
Some of them (like range and prompt parameters) already have default initial value, other (like sample and source parameters) should be provided manually. Also component count (if possible) should be manually adjusted like in sample or source case with special spin edit below proper parameters grid.
- note
- Some of theoretical models like Trapping Models have fixed component count to 1. In those cases component count cannot be changed and there is no spin edit below parameters grid.
To run calculations, there must be one of the parameters grid displayed, since the parameters grid defines which spectra will be fitted.
- note
- Displayed parameters grid doesn't determine fitting parameter set but spectra which will be fitted. For example, if displayed parameters grid is sample, other parameters will be fitted as well, as long as spectrum included in sample group is also included in other parameter groups.
- note
- Attempting to run calculations when displaying other page than that holding parameters grid (eg. Search) results in showing message box instructing to choose one of the parameters grid.
Calculations may be run in following ways:
- calculations for first spectrum in currently displayed parameters grid - Fit first spectrum
- calculations for all spectra in currently displayed parameters grid - Fit series of spectra
- calculations for custom spectrum in currently displayed parameters grid - Fit [spectrum_name] in parameters grid's context menu
- note
- While running calculations for either first spectrum or for all spectra in currently displayed series can
be achived by using calculations toolbar
 (or Project menu),
fitting custom spectrum can be done only through parameters grid's context menu.
(or Project menu),
fitting custom spectrum can be done only through parameters grid's context menu.
Every time calculations is about to run, Search tab of project is activated to allow user to follow calculations progress.
- note
- User may disable automatic switching to Search tab of project by deselecting Switch to Search tab after calculations run check box in General tab of Tools -> Options dialog.
Finished calculations, as well as each calculations progress, are prompted by proper entry in Events box in Search tab. Moreover, if calculations were run for single spectrum, special fit window appears with displayed fit for chosen spectrum, when calculations are over. If those fits are dissatisfactory, calculations may be repeated by clicking button Fit again in this window.