Fit window
From LT10 EVEL
| See also | Parameters Grid |
|---|
Fit window
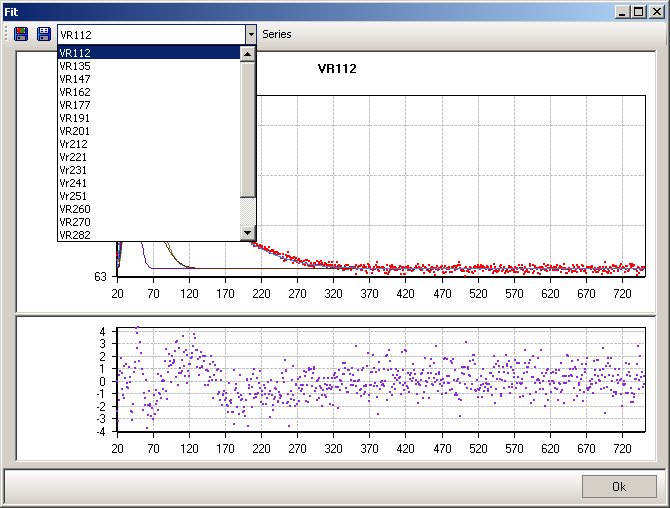
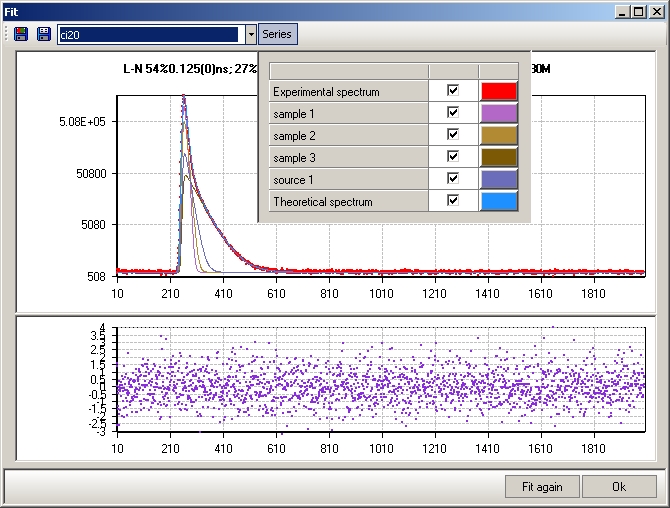
Tool which shows fit quality. Every time calculations for first spectra in each document ends with showing this window. Moreover, after series calculations you may see fit quality of any spectrum in series by choosing parameters grid's context menu -> Show spectrum fit. The top chart contains such series as
- Experimental spectrum
- Theoretical curve
- Curves representing each component in each group
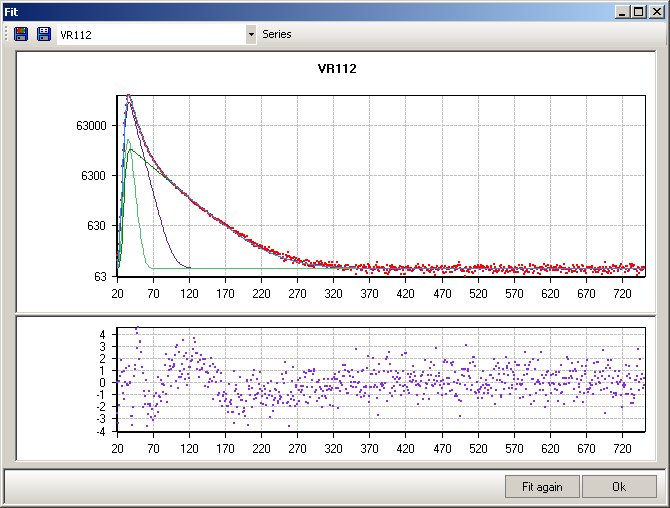
The bottom chart in fit window shows fit quality. The more even graph the better fit. If fit is not satisfying try clicking "Fit again".
Values in bottom chart are calculated with equation:
 where
where- i - channel number
- E[i] - value of experimental spectrum at channel i
- T[i] - value of theoretical curve at channel i
- D[i] - difference between theory and experiment at channel i
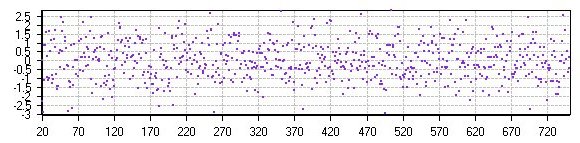 |
| Good fit |
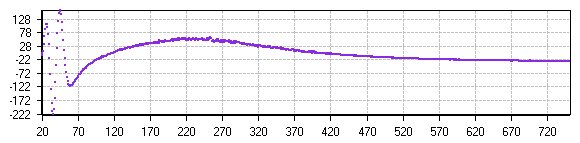 Bad fit |
It is possible to change the color of visible components in the top chart or even hide some of the components. To do that expand series list by clicking Series button on the top toolbar
Charts may be saved to either bitmap ![]() (*.bmp file with top and bottom charts with selected series)
or tab-separated files
(*.bmp file with top and bottom charts with selected series)
or tab-separated files ![]() (data which was used to draw charts)
(data which was used to draw charts)
If there are more documents in project and fit window appeared after fitting first spectra or fit window was called manually from parameters grid, you may switch displaying spectrum fit with combo box at toolbar.