Creating a New Chart
From IPFX Live Graphs
Creating a New Chart
To open a new Chart
- Click File
- Click New, i.e.
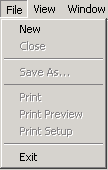
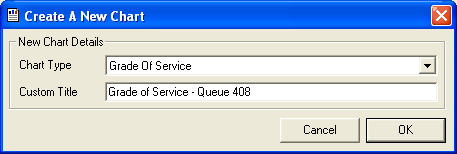
- The Create a New Chart screen displays.
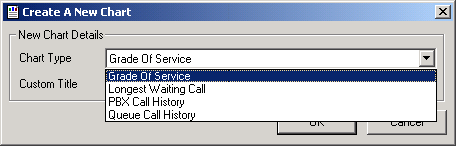
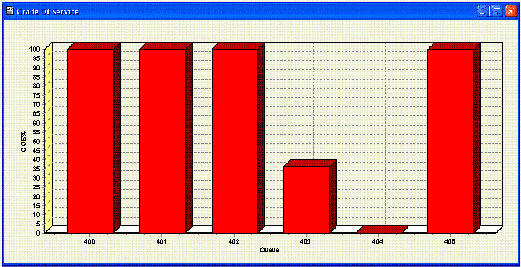
- Select your Chart from the drop-down Menu and the View will display.
To open a new Chart with a Customised Title
- Follows steps 1 to 3 above.
- Enter a Custom Title for your Chart, eg: Grade of Service for Queue 408.
- Click OK.
- The screen below displays.
- Click OK.
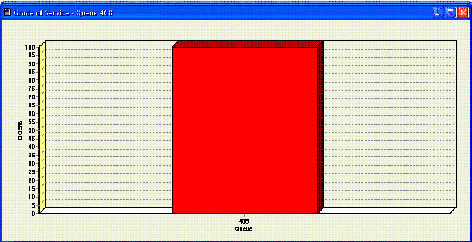
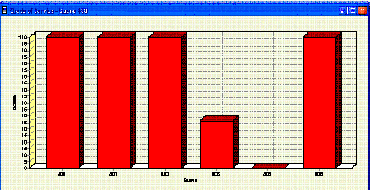
- A View similar to that shown below displays with the new name showing.
You can now filter this chart to select the Queue 408 only as follows:
- Right-click on the Chart
- Select Filter

- Select the Queue or Queues you wish to display
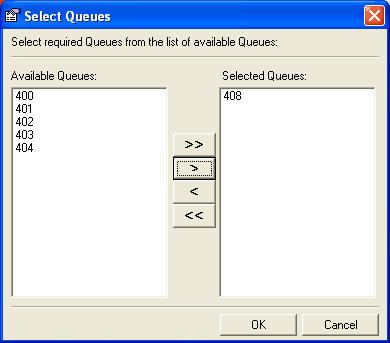
- Select OK to display your new View.