Graphs
From eCtune
Graphs
 Graphs window
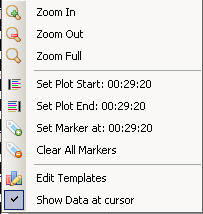
Graphs Context
menu(right-click)
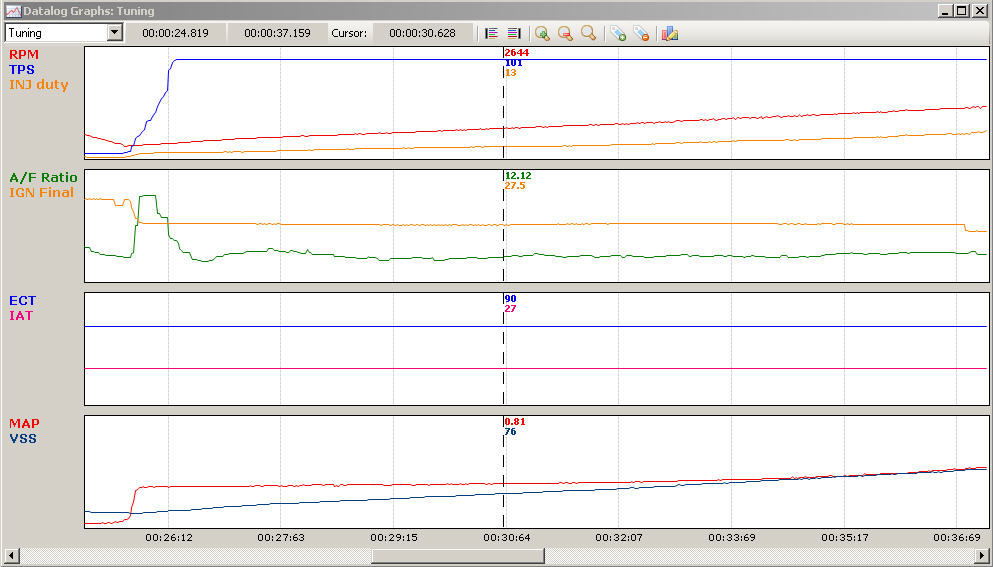
Datalogging Graphs:
-
Template:
Select the template you want to use ![]()
- Show data
at cursor: This will show the data from the plots at the current cursor.
- Zoom
In: This will zoom in the datalog
- Zoom out: This will zoom out if the datalog
is zoomed in
- Zoom full: this will show the complete datalog
- Set Marker:
This will put a cursor marker with data where the mouse is. We scrolling through
the log file you can see where you put flags(markers)
- Clear all markers: This
will remove all the markers currently set.
- Set plot start: This will set the
plot start frame(time)
-
Set plot end: This will set the plot end
frame(time)
Note: If a datalog is fully ploted you can zoom in on a piece of
the log with plot start and plot end
Example Dyno
Run: 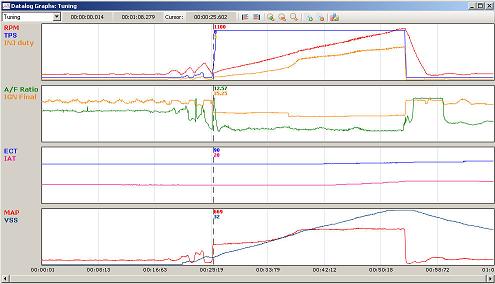
Full datalog 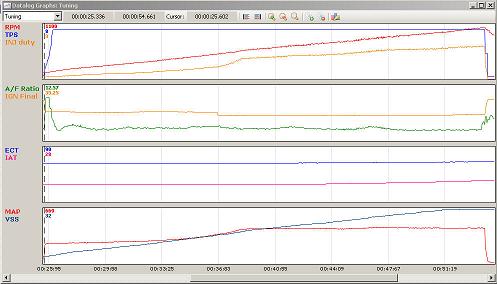
Used plot start at the beginning of the
run
Used plot end at the end of the run
Datalogging Graphs
Information: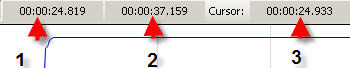
1: Plotted graph
start time
2: Plotted graph end time
3: Cursor
time
Graph
Shortcuts:
Left/Right:
Scroll through log file
Ctrl +
Left: Move
datalog cursor left(small step)
Ctrl +
Right: Move
datalog cursor right(small step)
Ctrl + Shift + Left: Move
datalog cursor left(large step)
Ctrl + Shift + Right: Move datalog cursor
right(large step)
Ctrl + Shift + Up: Zoom in
Ctrl +
Shift + Down: Zoom out