Table of Contents
- 6.1. Viewing packets you have captured
- 6.2. Pop-up menus
- 6.3. Filtering packets while viewing
- 6.4. Building display filter expressions
- 6.5. The "Filter Expression" dialog box
- 6.6. Defining and saving filters
- 6.7. Defining and saving filter macros
- 6.8. Finding packets
- 6.9. Go to a specific packet
- 6.10. Marking packets
- 6.11. Ignoring packets
- 6.12. Time display formats and time references
Once you have captured some packets, or you have opened a previously saved capture file, you can view the packets that are displayed in the packet list pane by simply clicking on a packet in the packet list pane, which will bring up the selected packet in the tree view and byte view panes.
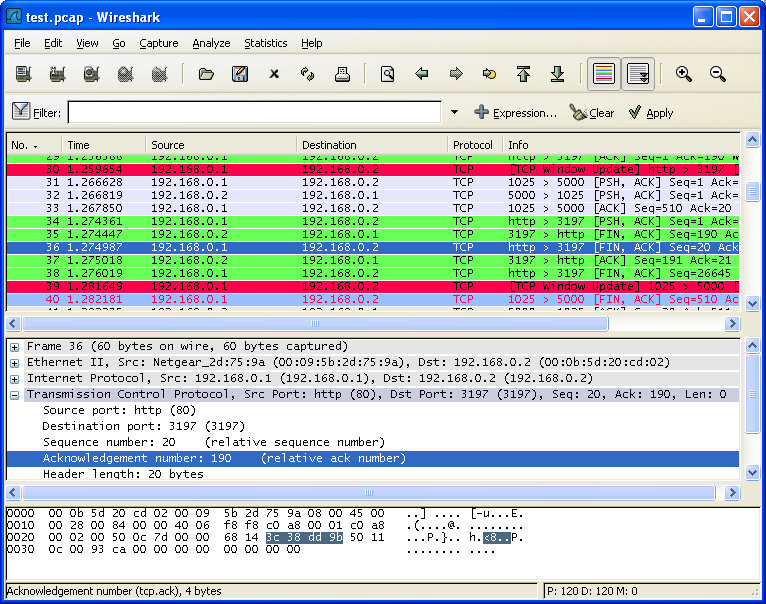
You can then expand any part of the tree view by clicking on the plus sign (the symbol itself may vary) to the left of that part of the payload, and you can select individual fields by clicking on them in the tree view pane. An example with a TCP packet selected is shown in Figure 6.1, “Wireshark with a TCP packet selected for viewing”. It also has the Acknowledgment number in the TCP header selected, which shows up in the byte view as the selected bytes.
You can also select and view packets the same way, while Wireshark is capturing, if you selected "Update list of packets in real time" in the Wireshark Capture Preferences dialog box.
In addition, you can view individual packets in a separate window as shown in Figure 6.2, “Viewing a packet in a separate window”. Do this by selecting the packet in which you are interested in the packet list pane, and then select "Show Packet in New Windows" from the Display menu. This allows you to easily compare two or even more packets.

