About charts
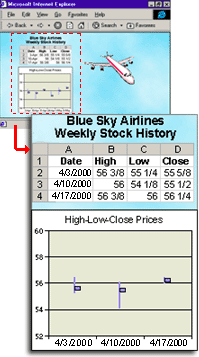
Charts are visually appealing and make it easy for you to see comparisons, patterns, and trends in data. With the Microsoft Office Chart Component, you can interact with a dynamic chart that updates to reflect the latest changes to the data on which the chart is based.

If you have access to the data on which the chart is based, you can change the data, refresh the Web page, and see the changes reflected in the chart.
Depending on how the chart was created, it might use fields to organize the data. In these types of charts, you can rearrange fields as well as sort and filter the data, if the designer of the Web page has provided the ability to do so. You can also add or remove legends, change series to categories, and more.
To work with a chart interactively, you should have the Office Web Components installed. You can do this by installing Microsoft Office 2003 or, if your company has an Office 2003 site license, by downloading the Office Web Components from your corporate intranet. You must also have Microsoft Internet Explorer version 5.01 SP2 or later to work with a chart interactively, unless you view the chart from within a Microsoft Visual Basic for Applications (VBA) project.
If your system does not meet the above requirements, you might be able to view a chart but not interact with it. For more information, see the designer of the Web page or application, or see your system administrator.

 Interacting with a chart