Setting conditions for GLUE to estimate coefficients
From Generalized Likelihood Uncertainty Estimation
|
Setting conditions for GLUE to estimate coefficients |
Top Previous Next |
|
The GlueSelect program was written by Paul Wilkens (IFDC) as a tool in DSSAT v4.5. This tool uses much of the code that he and L. A. Hunt developed for GenSelect, which is a rule-based estimator of cultivar coefficients. Currently, the GLUE program operates on most crops (except those legacy crops that are not converted to v4.5 standards). However, we are more confident of the program correctly estimating cultivar coefficients for the following crops: maize, soybean, peanut, millet, sorghum, chickpea, cotton, fababean, sweet corn, tomato, green beans, rice, wheat, and drybean. Users should check the coefficients carefully before using them. This can be done by putting the estimated parameters in the appropriate CUL file and simulating the crop interactively for comparison with observed data.
The file that has definitions of genetic coefficients and their ranges of uncertainty for all crops is ParameterProperty.xls (see Appendix A for details), and MeasurementVariance.xls (see Appendix B). These files are stored in the directory C:\DSSAT45\Tools\GLUE\. Advanced model users can modify them to set other ranges of parameters, change parameters to be estimated, introduce parameters for new crops, and change the order in which they are estimated.
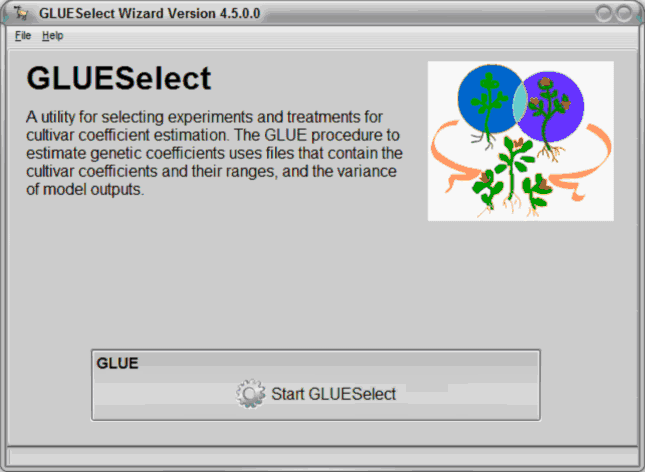
The GLUE program is integrated into the DSSAT45 shell, and the user runs the GlueSelect program from the DSSAT Tools menu to start the process (Figure 5).
Figure 5. Initial screen when GLUESelect program is run.
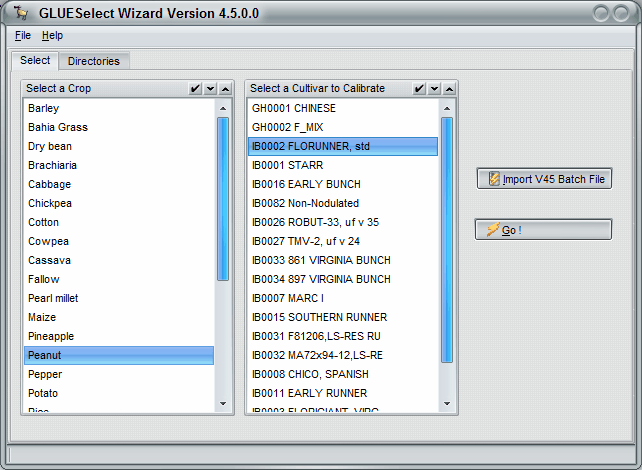
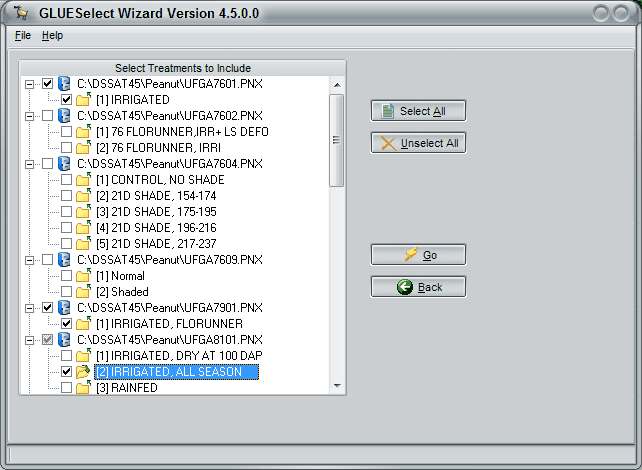
The second GlueSelect screen shows all of the crops. A user selects a crop, such as peanut as shown in Figure 6, and then a particular cultivar that is to be estimated (FLORUNNER, std in Figure 6). After selecting Go on this screen, a list of experiments and treatments will appear (Figure 7). In this figure, three growing seasons were selected from three different years and experiments. These treatments will be simulated, using the Monte Carlo method to estimate the coefficients that give the maximum likelihood for both phenology and growth measurements.
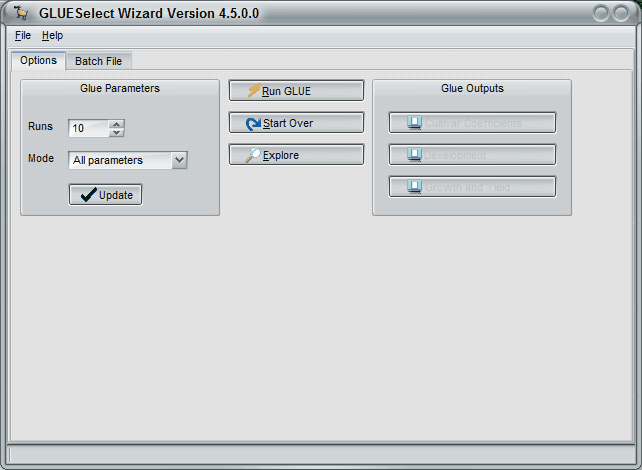
The third GlueSelect screen shows the console for operating the actual GLUE calculations and viewing the results. Figure 8 shows, for example, that there are to be 3,000 runs for all parameters, which means that there will be 3,000 runs for phenology parameters and another 3,000 for growth parameters. This number can be changed to a few, say 10, to make sure that the program is operating ok. However, results from runs less than 3,000 would not likely give reliable results. So, if the number is changed from 3,000 to test the procedure, then it must be changed back to 3,000 (or more) in order to get reliable results. It is ok to increase this number to further refine the results, but more time will be required if this is done.
Figure 6. GlueSelect screen for selecting the crop and cultivar showing selection of peanut and FLORUNNER,std cultivar.
Figure 7. GlueSelect screen showing selection of 3 specific treatments (in three experiments) for use in estimating cultivar coefficients for the previously selected cultivar FLORUNNER,std.
Figure 8. Screen shot showing which coefficients to estimate, how many runs to make, running the program, and viewing the outputs. |