Creating and Managing Traces and Templates
In Microsoft® SQL Server™, you can use SQL Profiler to create one or more templates that define the criteria for each event you want to monitor. You can save the template to a file with the .tdf extension. A template is not executed. After you define the template, you run a trace that records the data for each event you selected.
For example, you can create a template, specifying which events, data columns, and filters to use. Then you can save the template and launch a trace with the current template settings. The trace data captured is based upon the options specified in the template. You can specify where the trace results can be saved (for example, in a trace file (.trc extension file) or a trace table).
Default Templates
Before creating a trace using SQL Profiler, you can specify a default trace template. To select a default trace template, go to the Tools menu, and then select Options.
You can also specify:
- To start the default trace immediately after making a connection.
- The number of lines of trace data buffered for display. If window auto-scrolling is disabled and the specified limit is reached, the trace pauses until you scroll down to the last row. At this point, 10 percent of the top rows are deleted and the trace continues.
- A font for the displayed trace data.
- A font size for the displayed trace data.
When creating a trace, you can specify the following:
- A trace name.
- Which instance of SQL Server to trace.
- Options for saving trace data. For example, you can choose to capture trace data to the server file. If you choose this option, you must capture trace data to the server being traced and set a maximum file size for the server file. If the maximum file size is reached, you can enable the file rollover option, which creates new files to store the trace data. You can also save a trace to a file, table, or a combination of these options. If you will be tracing a large amount of data, you should save the data to the server file. This guarantees that all events produced will be saved in the file. There is a limit of 1 gigabyte (GB) for maximum file size.
- A trace stop time.
- Events to trace. For more information about the event classes available, see Monitoring with SQL Profiler Event Categories.
- Data columns to capture. For more information about the data columns available, see Monitoring with SQL Profiler Event Categories.
- Filters that specify the criteria for determining which events to capture.
Using System Stored Procedures
SQL Profiler uses system stored procedures to create traces and send the trace output to the appropriate destination. These system stored procedures can be used from within your own applications to create traces manually, instead of using SQL Profiler. This allows you to write custom applications specific to the needs of your enterprise. For example, when using system stored procedures to create traces, you can:
- Configure traces.
- Forward trace events from one or more servers to a file.
The following table compares the SQL Server 2000 system stored procedures to the SQL Server version 7.0 stored procedures.
| 7.0 extended stored procedure | 2000 stored procedures |
|---|---|
| xp_trace_geteventclassrequired | fn_trace_geteventinfo |
| xp_trace_getqueuecreateinfo | fn_trace_geteventinfo |
| xp_trace_getqueueproperties | fn_trace_geteventinfo |
| xp_trace_getqueuecreateinfo | fn_trace_getinfo |
| xp_trace_getqueuedestination | fn_trace_getinfo |
| xp_trace_getqueueproperties | fn_trace_getinfo |
| xp_trace_addnewqueue | sp_trace_create |
| xp_trace_setqueuecreateinfo | sp_trace_create |
| xp_trace_setqueuedestination | sp_trace_create |
| xp_trace_generate_event | sp_trace_generateevent |
| xp_trace_addnewqueue | sp_trace_setevent |
| xp_trace_eventclassrequired | sp_trace_setevent |
| xp_trace_seteventclassrequired | sp_trace_setevent |
| xp_trace_destroyqueue | sp_trace_setstatus |
| xp_trace_pausequeue | sp_trace_setstatus |
| xp_trace_restartqueue | sp_trace_setstatus |
| xp_trace_startconsumer | sp_trace_setstatus |
| xp_trace_getappfilter | fn_trace_getfilterinfo |
| xp_trace_getconnectionidfilter | fn_trace_getfilterinfo |
| xp_trace_getcpufilter | fn_trace_getfilterinfo |
| xp_trace_getdbIdfilter | fn_trace_getfilterinfo |
| xp_trace_getdurationfilter | fn_trace_getfilterinfo |
| xp_trace_geteventfilter | fn_trace_getfilterinfo |
| xp_trace_gethostfilter | fn_trace_getfilterinfo |
| xp_trace_gethpIdfilter | fn_trace_getfilterinfo |
| xp_trace_getIndIdfilter | fn_trace_getfilterinfo |
| xp_trace_getntdmfilter | fn_trace_getfilterinfo |
| xp_trace_getntnmfilter | fn_trace_getfilterinfo |
| xp_trace_getobjidfilter | fn_trace_getfilterinfo |
| xp_trace_getreadfilter | fn_trace_getfilterinfo |
| xp_trace_getserverfilter | fn_trace_getfilterinfo |
| xp_trace_getseverityfilter | fn_trace_getfilterinfo |
| xp_trace_getspIdfilter | fn_trace_getfilterinfo |
| xp_trace_getsysobjectsfilter | fn_trace_getfilterinfo |
| xp_trace_gettextfilter | fn_trace_getfilterinfo |
| xp_trace_getuserfilter | fn_trace_getfilterinfo |
| xp_trace_getwritefilter | fn_trace_getfilterinfo |
| xp_trace_setappfilter | sp_trace_setfilter |
| xp_trace_setconnectionidfilter | sp_trace_setfilter |
| xp_trace_setcpufilter | sp_trace_setfilter |
| xp_trace_setdbIdfilter | sp_trace_setfilter |
| xp_trace_setdurationfilter | sp_trace_setfilter |
| xp_trace_seteventfilter | sp_trace_setfilter |
| xp_trace_sethostfilter | sp_trace_setfilter |
| xp_trace_sethpIdfilter | sp_trace_setfilter |
| xp_trace_setIndIdfilter | sp_trace_setfilter |
| xp_trace_setntdmfilter | sp_trace_setfilter |
| xp_trace_setntnmfilter | sp_trace_setfilter |
| xp_trace_setobjidfilter | sp_trace_setfilter |
| xp_trace_setreadfilter | sp_trace_setfilter |
| xp_trace_setserverfilter | sp_trace_setfilter |
| xp_trace_setseverityfilter | sp_trace_setfilter |
| xp_trace_setspIdfilter | sp_trace_setfilter |
| xp_trace_setsysobjectsfilter | sp_trace_setfilter |
| xp_trace_settextfilter | sp_trace_setfilter |
| xp_trace_setuserfilter | sp_trace_setfilter |
| xp_trace_setwritefilter | sp_trace_setfilter |
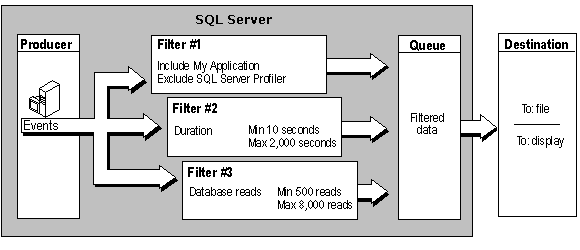
System stored procedures expose the underlying architecture used to create traces. The architecture components are:
Producer
Generates the events to be monitored. The SQL Server lock manager, which generates lock events, is an example of a
Filter
Restricts the data monitored by the trace. For more information, see Limiting Traces.
Destination
Houses event data extracted from the trace in files.

To define your own trace using stored procedures:
- Specify the events to capture using sp_trace_setevent.
- Specify any event filters. For more information, see How to set a trace filter (Transact-SQL).
- Specify the destination for the captured event data using sp_trace_create.
To set trace definition defaults