


| VLF .NET Snap-in Components - Developer's Guide | |
| Debugging | |
| Send comments on this topic. | |
Glossary Item Box
To debug your .NET components Using Visual Studio, you need to first run VLF.NET on your computer by navigating your browser to the application URL.
After VLF.NET is running, switch to Visual Studio and attach your source code to your application process. If your framework is called HR_Framework and you are running the ENG language version of it, the process name would be HR_Framework_ENG.app.exe.
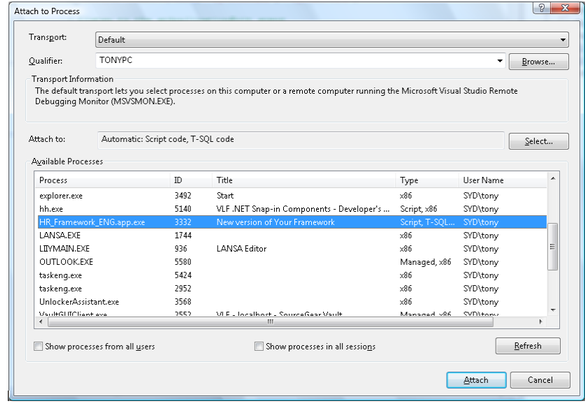


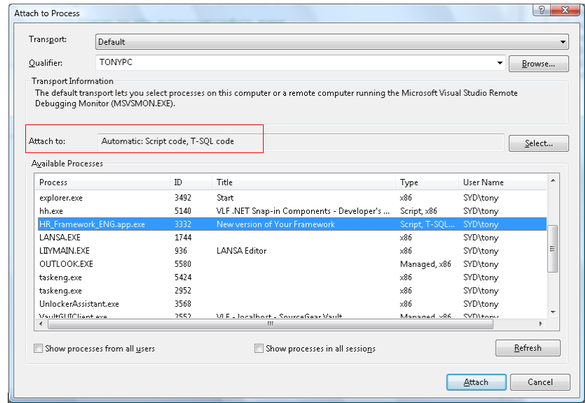
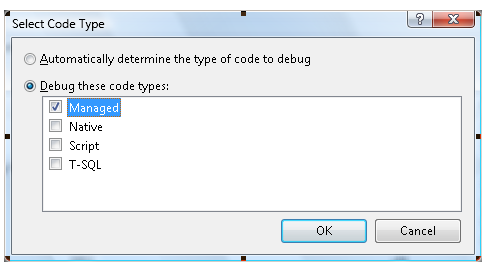
Now pay attention to the Attach to above the Available Processes. Because we are debugging managed .NET code it has to show Managed Code. If it does not show Managed Code you will have to force it by clicking on the Select button next to it, select the second radio button, and tick Managed Code.
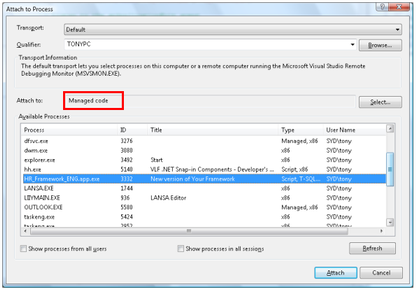
Your assembly is now running attached to the VLF.NET process.
Now put a breakpoint inside one of the methods in one of your .NET components. Go back to VLF.NET, navigate to the business object associated with the .NET component. Visual Studio will enter debug mode when your breakpoint is hit.